
State-gated job actions
Add and inspect jobs, promote delayed work, and update eligible job data, priority, delay or progress. DLQ retry, completed-job requeue and destructive Cancel fail closed under the v2.9.3 contract. Job Inspector →
bunqueue dashboard
A free, open source web UI that safely operates a bunqueue server (a fast, Redis-free, Bun-native background-job queue): queues, jobs, dead-letter queue, cron, webhooks, workers and live activity, plus start / stop / restart of the server process itself. Built for Bun developers and AI-agent builders who want to operate their queue, not just watch it. It uses Bunqueue's public HTTP API plus its pinned public client/CLI behind a tiny loopback control agent, and fails closed when the v2.9.3 contract cannot make a mutation atomic.
Open the live demoQuick startGitHub
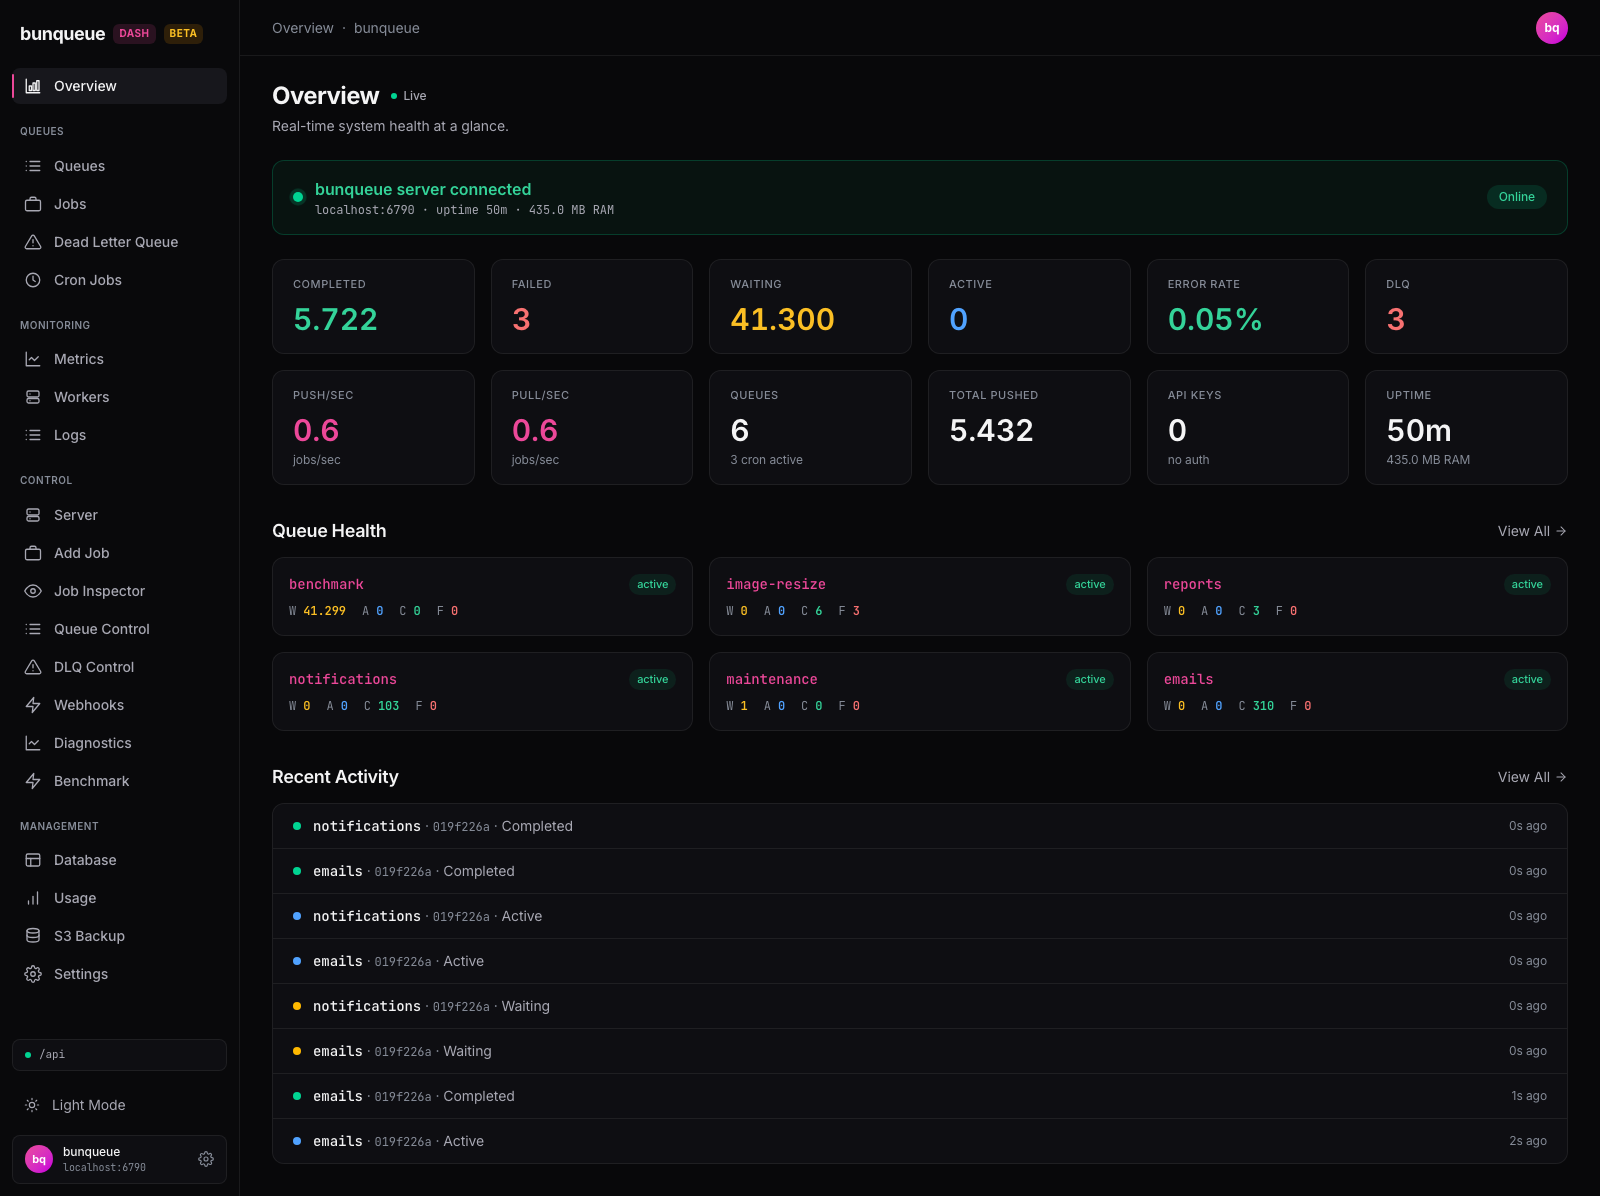
Overview
Everything an operator needs to run a bunqueue server from the browser, from state-gated job actions right through to the process lifecycle. Every card below is a shipped page you can open in the demo right now.
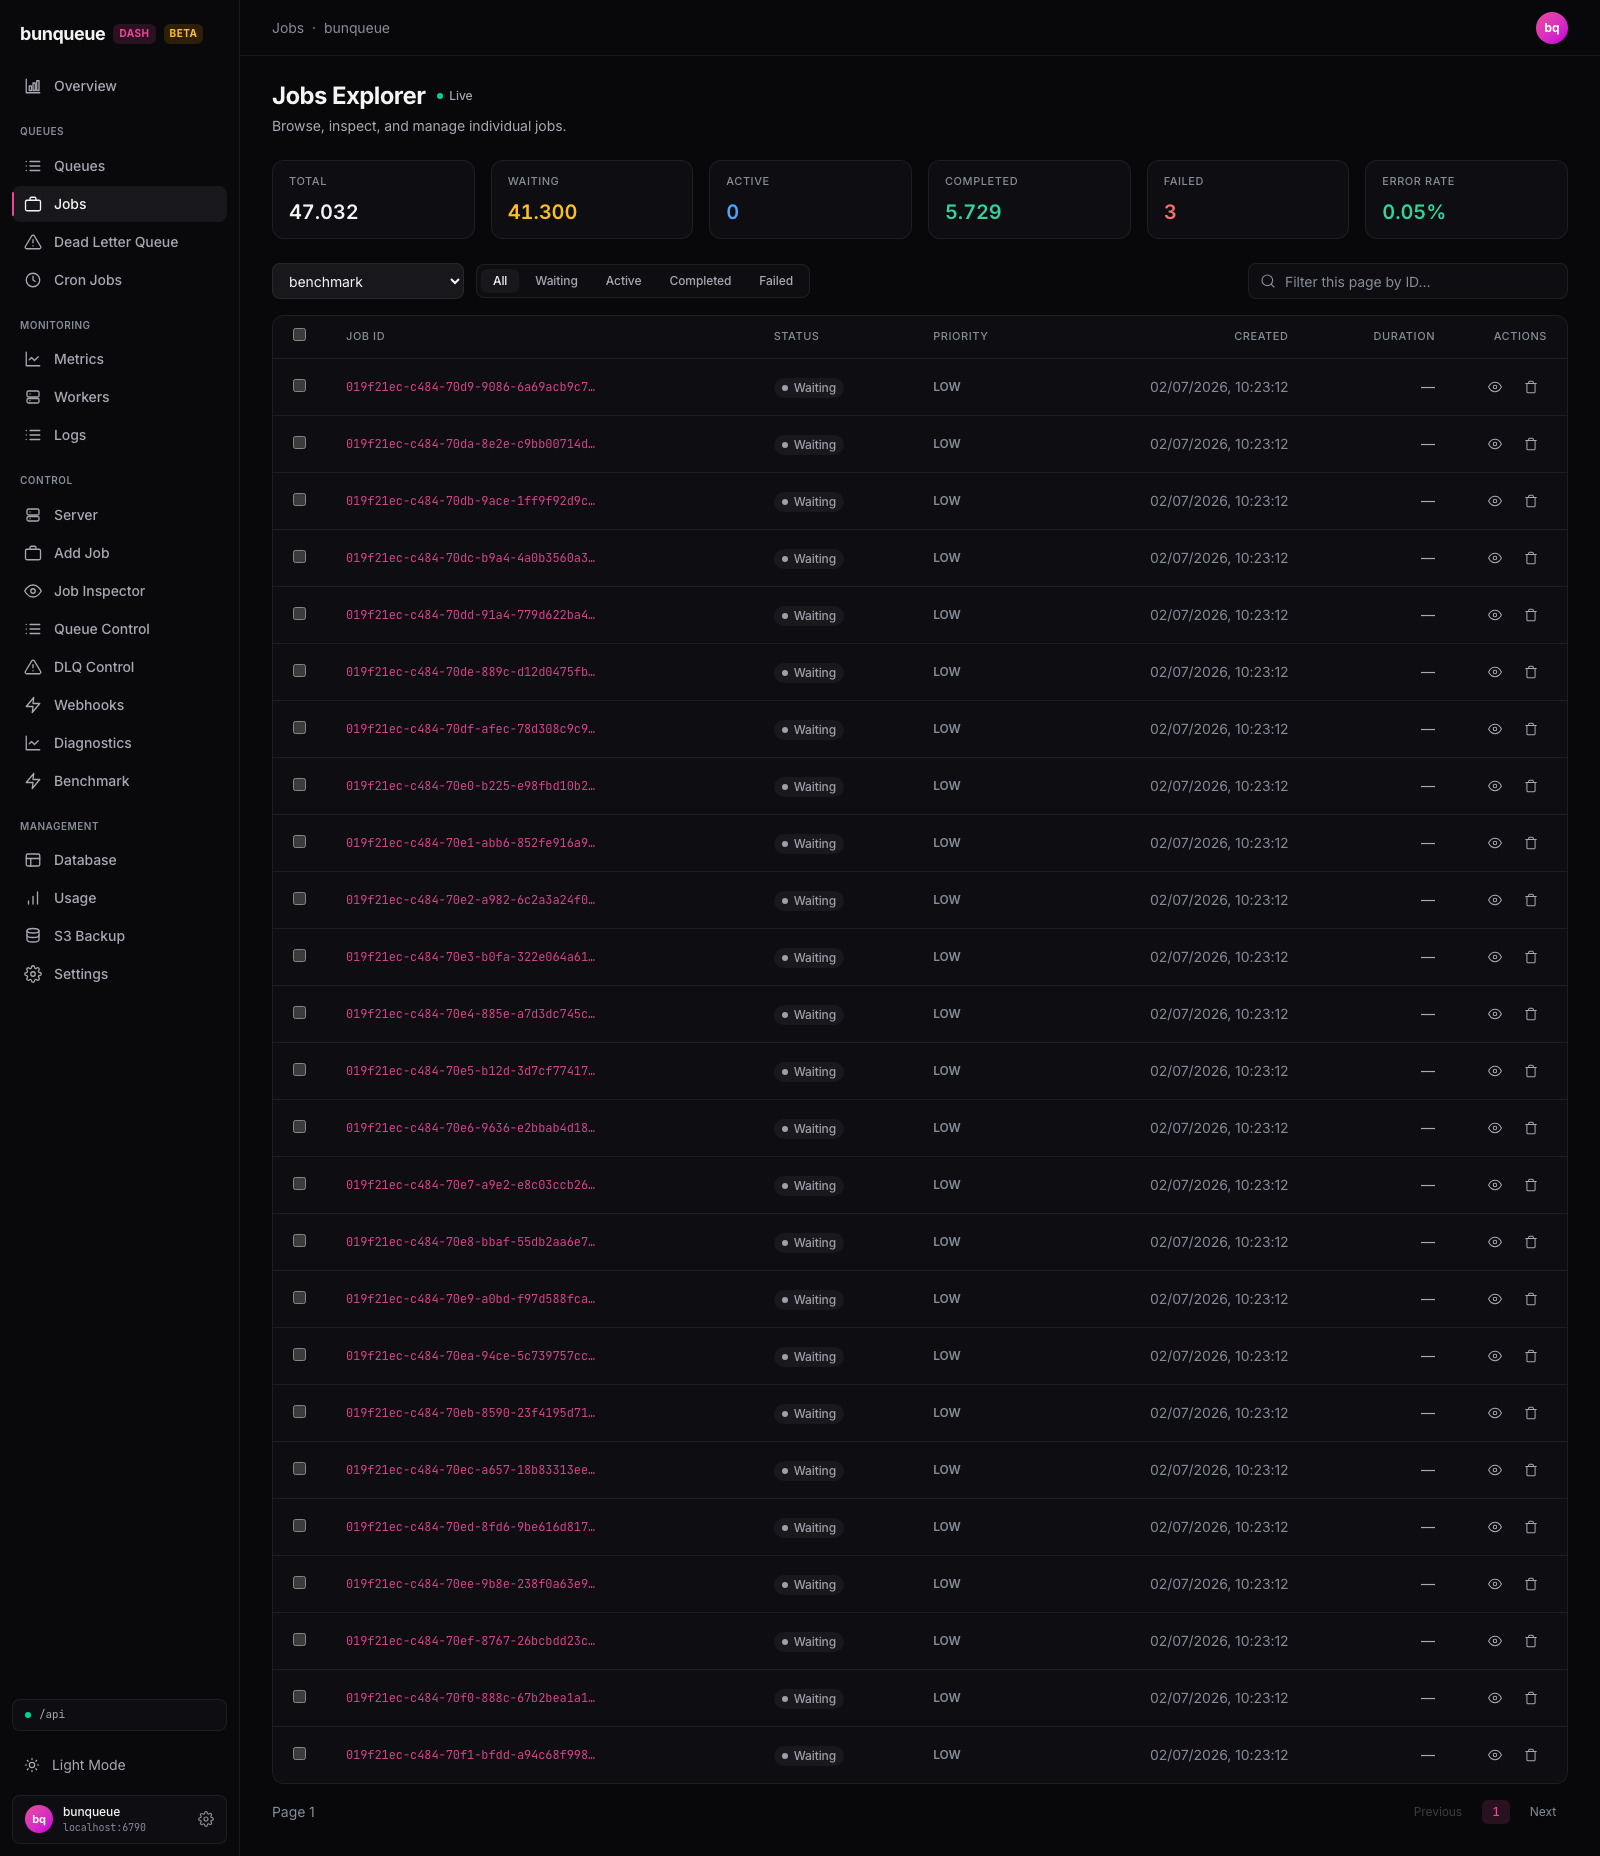
Add and inspect jobs, promote delayed work, and update eligible job data, priority, delay or progress. DLQ retry, completed-job requeue and destructive Cancel fail closed under the v2.9.3 contract. Job Inspector →
A Server-Sent-Events feed with automatic reconnect shows jobs flowing in real time. It is built on fetch, so it works with bearer-token auth, unlike EventSource. Live logs →
A fleet-wide dead-letter dashboard plus a single-queue triage surface: failure reasons, per-attempt history and CSV export. Manual, bulk and Copilot retry remain unavailable because the GET + POST sequence has no atomic generation/state/topology precondition; purge is disabled too. DLQ Control →
Schedule by cron expression or interval-in-ms with a next-runs preview, then list and delete existing schedules. Cron →
Register endpoints with event scoping and an optional HMAC secret; watch success/failure counts, toggle, delete. Webhooks →
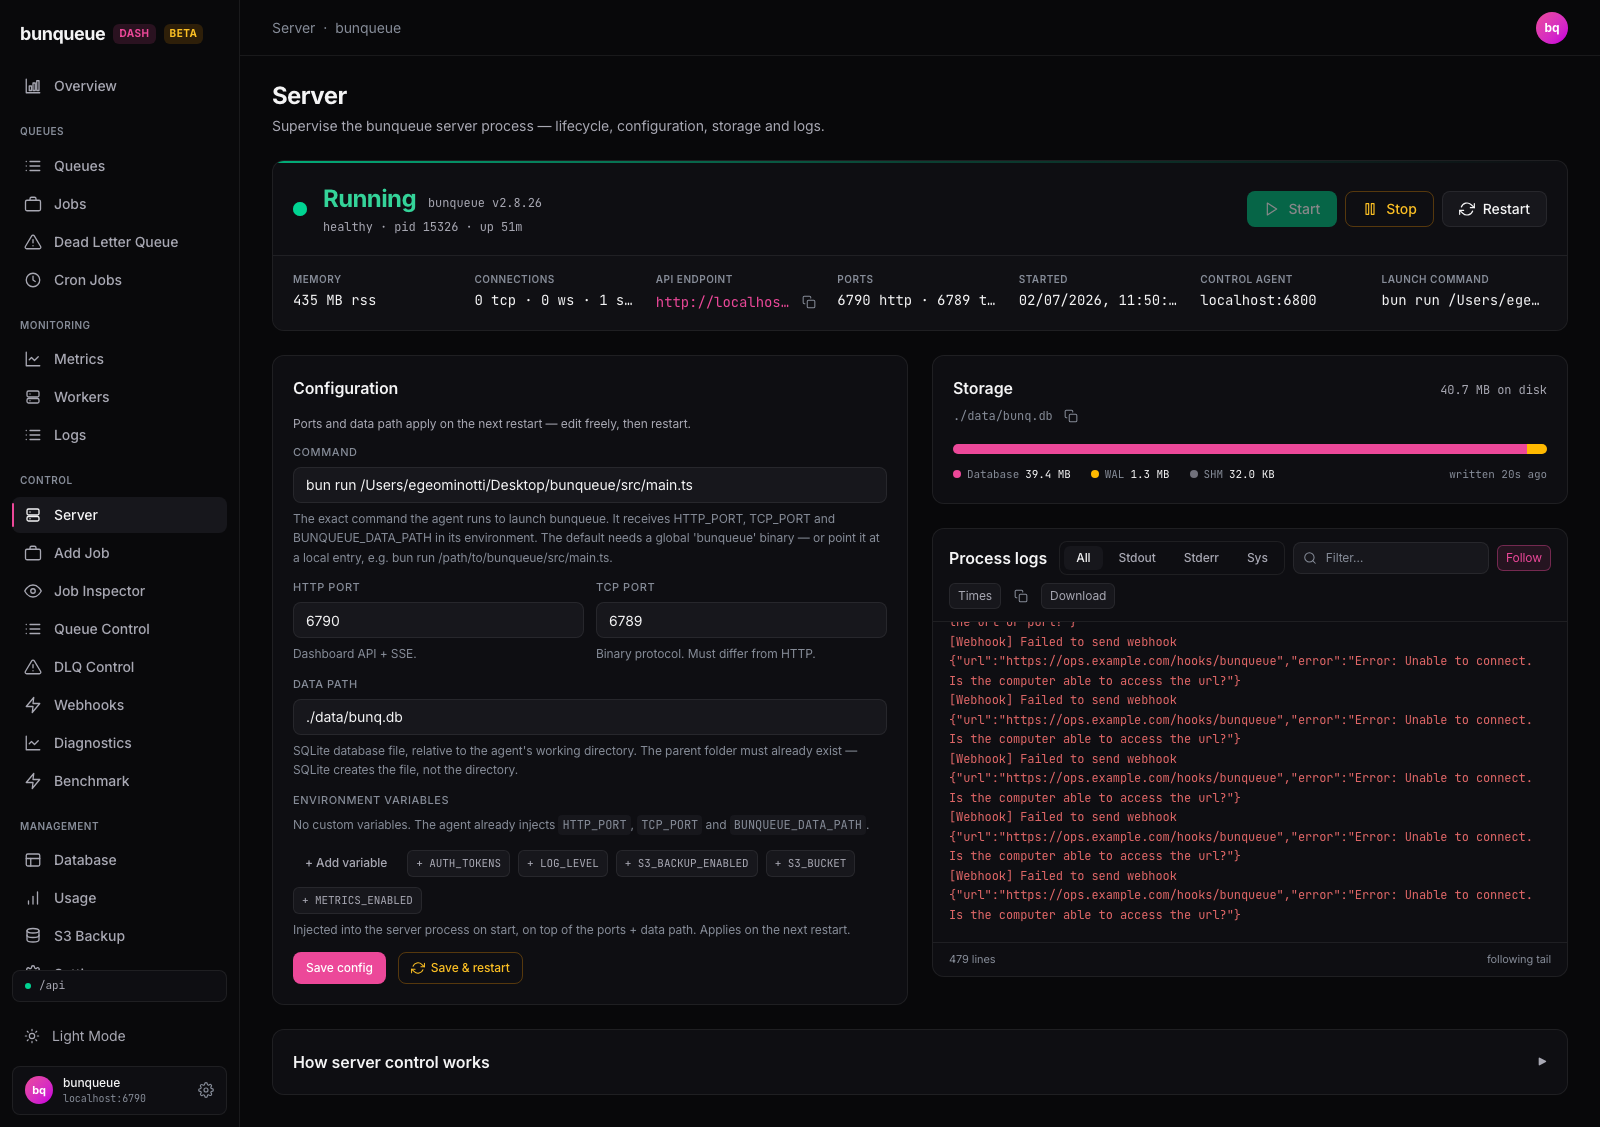
The one thing HTTP can't do, namely starting, stopping and restarting the bunqueue process, is delegated to a small loopback-bound agent with an Origin + Host allowlist, locked CORS and a bearer token required for remote or proxied access. Server Control →
Browse tables, schema and indexes, page through rows, run SELECT-only queries with EXPLAIN and CSV/JSON export, all over a read-only connection, capped at 500 rows. Database →
Rolling live throughput charts, error-rate gauge, per-operation latency percentiles (push / pull / ack × p50 / p95 / p99). Metrics →
Threshold rules on queue depth, failures, error rate and latency, evaluated in the browser, with in-app toasts and desktop notifications. Alerts →
Push and drain load runs against any queue, in count or duration mode, with a live chart and run history. Benchmark →
Explore parent/child/dependency DAGs, create every official FlowProducer shape, and operate safe Flow Job methods. Job Flows →
Tour
A real control surface, not a read-only viewer, so every screen in this tour is a live page you can drive in the demo.
Surface
Process
The priority is simplicity: one command serves the dashboard, proxies the API and runs the control agent. No clone, no build.
One process serves the dashboard on http://127.0.0.1:8080, proxies /api/* to your bunqueue server and runs the control agent.
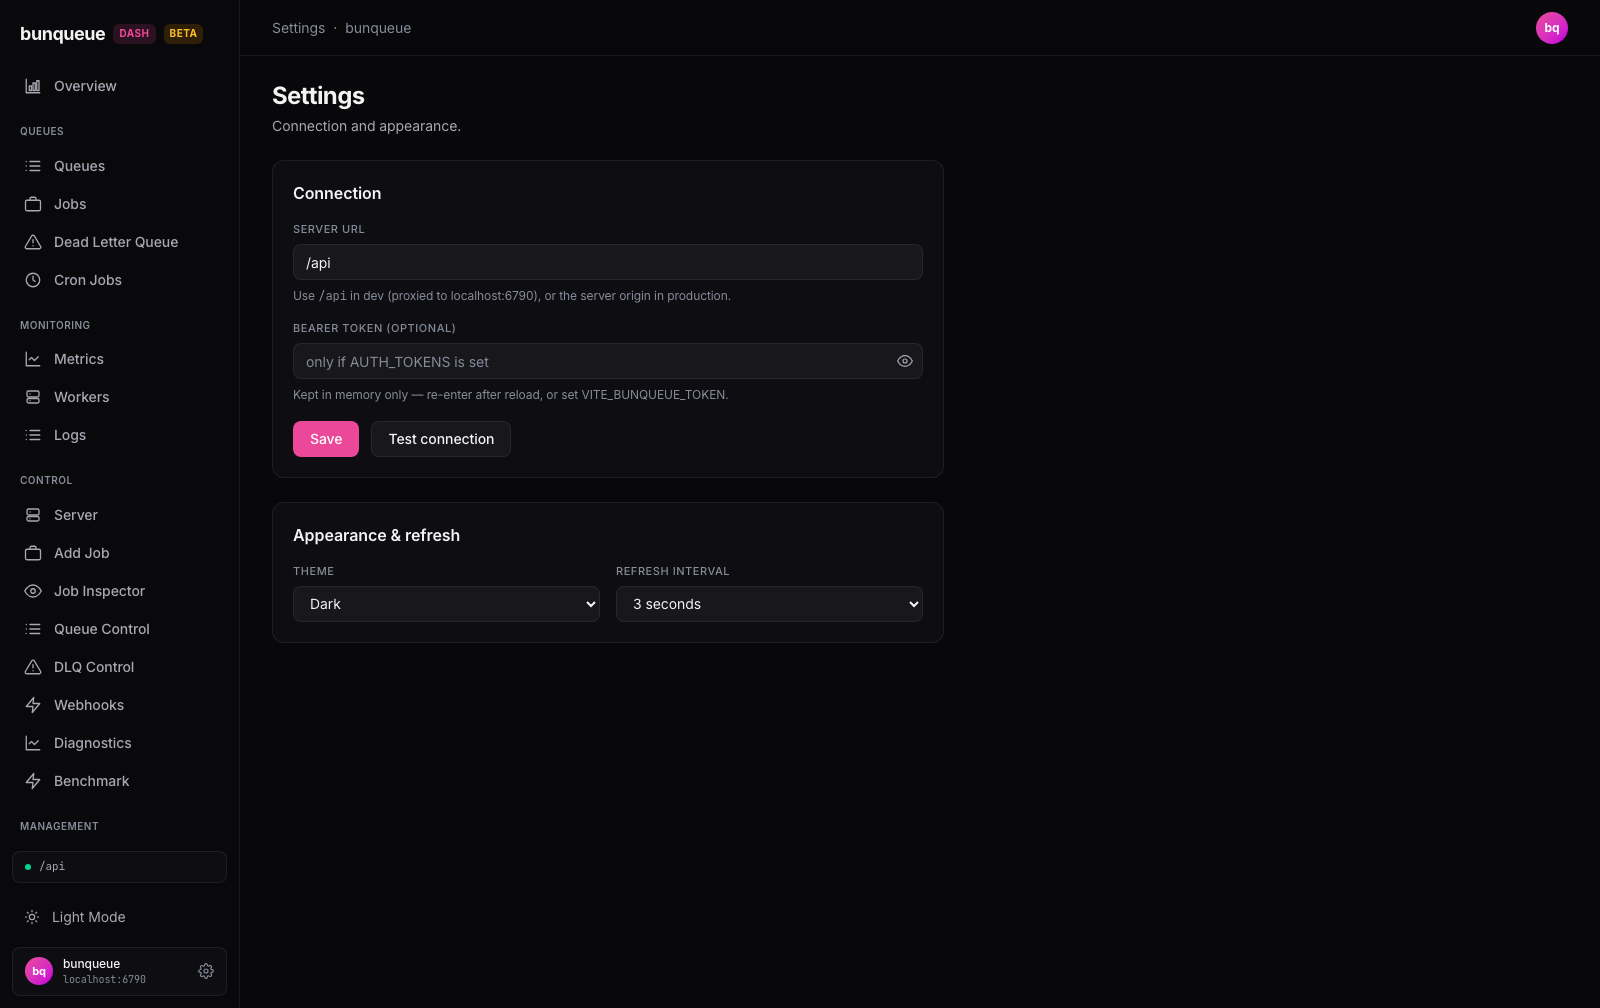
bunx bunqueue-dashboardCreate one or more named server + paired-agent profiles in Settings. Tokens stay in memory and are isolated per profile; defaults may come from BUNQUEUE_URL / VITE_BUNQUEUE_URL.
From Control ▸ Server the agent starts, stops and restarts the bunqueue process, with an editable launch config and a colour-coded live log tail.
Explore jobs, triage the DLQ, schedule cron, watch live activity. Destructive actions are confirmed and name their target; everything else is one click.
Get started
Four ways to run it, pick the one that fits. All of them serve the same app.
bunx bunqueue-dashboard
# → http://127.0.0.1:8080, serves the SPA plus the /api proxy and control agent# Download the binary for your platform from the GitHub Releases page,
# then make it executable and run it, nothing else to install:
chmod +x bunqueue-dashboard-v*-darwin-arm64
./bunqueue-dashboard-v*-darwin-arm64
# → http://localhost:8080docker run --rm -p 8080:80 ghcr.io/egeominotti/bunqueue-dashboard:edge
# → http://localhost:8080, set the server URL from the Settings pagebun install
bun start
# agent (http://127.0.0.1:6800) + dashboard (http://localhost:5273) togetherFAQ
A complete operator surface over bunqueue's HTTP API: scheduling, triage, limits, live activity and process lifecycle in one UI, with every job action gated by the job's real state, instead of hand-rolled curl scripts and guesswork about which action a job will accept.
No. It never modifies Bunqueue. Ordinary operations use the public HTTP API; Flow and Workflow controls use the pinned public client through the loopback agent. Source-mode backup controls invoke the installed CLI, while the standalone executable embeds that same pinned backup command in an isolated worker so it never recursively launches itself. The compile and E2E gates make any internal CLI layout drift fail visibly during an upgrade. The SQLite inspector opens its own read-only connection and accepts SELECT-style statements only, so it cannot write even if asked to.
The agent can spawn processes, so it's locked down: a direct loopback listener, an Origin allowlist with CORS never set to *, and a Host-header allowlist against DNS rebinding. Truly local access can remain zero-config; a LAN or reverse-proxied /agent bridge requires AGENT_TOKEN on every route, while the all-in-one /api proxy separately requires BUNQUEUE_TOKEN. The full threat model is in the agent docs.
In memory only. Server tokens, agent tokens, S3 keys and webhook targets are deliberately excluded from localStorage, so re-enter them per session or use authentication at your front proxy. Never put secrets in VITE_* variables: they become plaintext in the public bundle.
Yes, the live demo runs the real app against fixture data in your browser. Every page works, no backend required.
Four ways: the prebuilt npm package (bunx bunqueue-dashboard), a standalone binary for linux/macOS/windows, the multi-arch Docker image, or from source. The binary embeds the SPA, the API proxy and the agent in one file.
Alerts are evaluated in the browser while a tab is open, so it's not away-from-desk paging. S3 credentials remain session-only even though configuration and operations are available in the UI. Mutations that v2.9.3 cannot make atomic are intentionally disabled, including every DLQ retry and completed-job requeue. DLQ maxAge/maxEntries are shown read-only and omitted from saves; auto-retry can only be disabled. Every verified contract gap is listed on the known issues page.
The dashboard does not send analytics. The Copilot is switched off in official builds; only a custom build that enables it sends Copilot requests, directly from your browser to your configured model provider. Remote broker/agent connections, configured S3 operations and broker webhook deliveries also contact the endpoints you choose.