
Appendix, classic pages
The first-generation pages, kept intact per the additive rule. Several have been superseded by a Pro page at the plain path (the classic version moved to a -classic suffix); QueueDetail is still the only per-queue drill-in view.
Queue Detail (classic)
Route
/queues/:name· sourcesrc/pages/QueueDetail.tsx
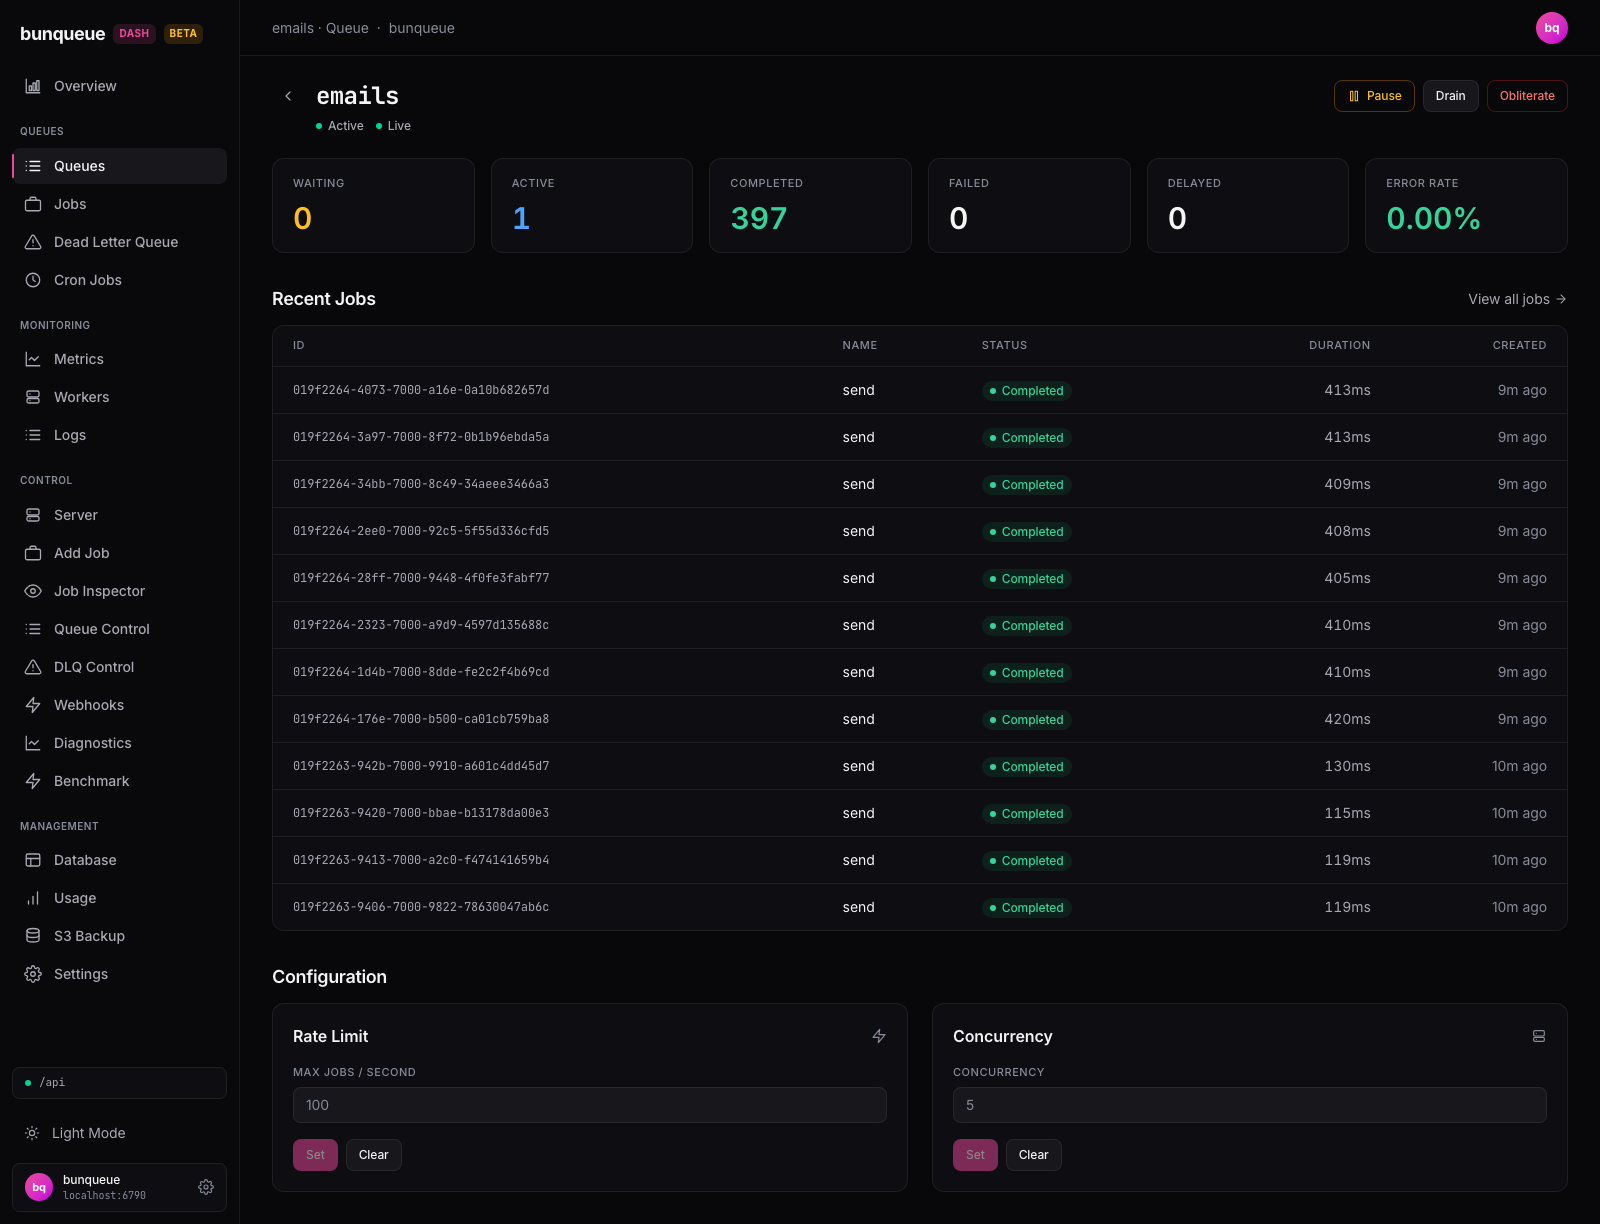
What it shows: The single-queue drill-in, opened by clicking a row on the classic Queues list. The screenshot shows the emails queue: six stat cards, a 12-row Recent Jobs table and a Configuration section. The route first verifies real membership through /queues/summary; an unknown queue exposes no mutations. Pause/Resume is guarded by server+queue ownership and a fresh membership check. Drain and Obliterate remain visible but disabled because v2.9.3 cannot prove cross-queue flow safety. Rate-limit and concurrency cards perform explicitly labelled blind desired-state writes with safe-integer validation, a mandatory rate window, explicit TTL mode, typed queue confirmation for clear, and timestamped receipts.
Differences vs the Pro page: no Pro drill-in exists; Queue Control offers the same actions plus stall/DLQ configuration, but via a queue dropdown rather than a per-queue URL.
Overview (classic)
Route
/overview-classic· sourcesrc/pages/Overview.tsx
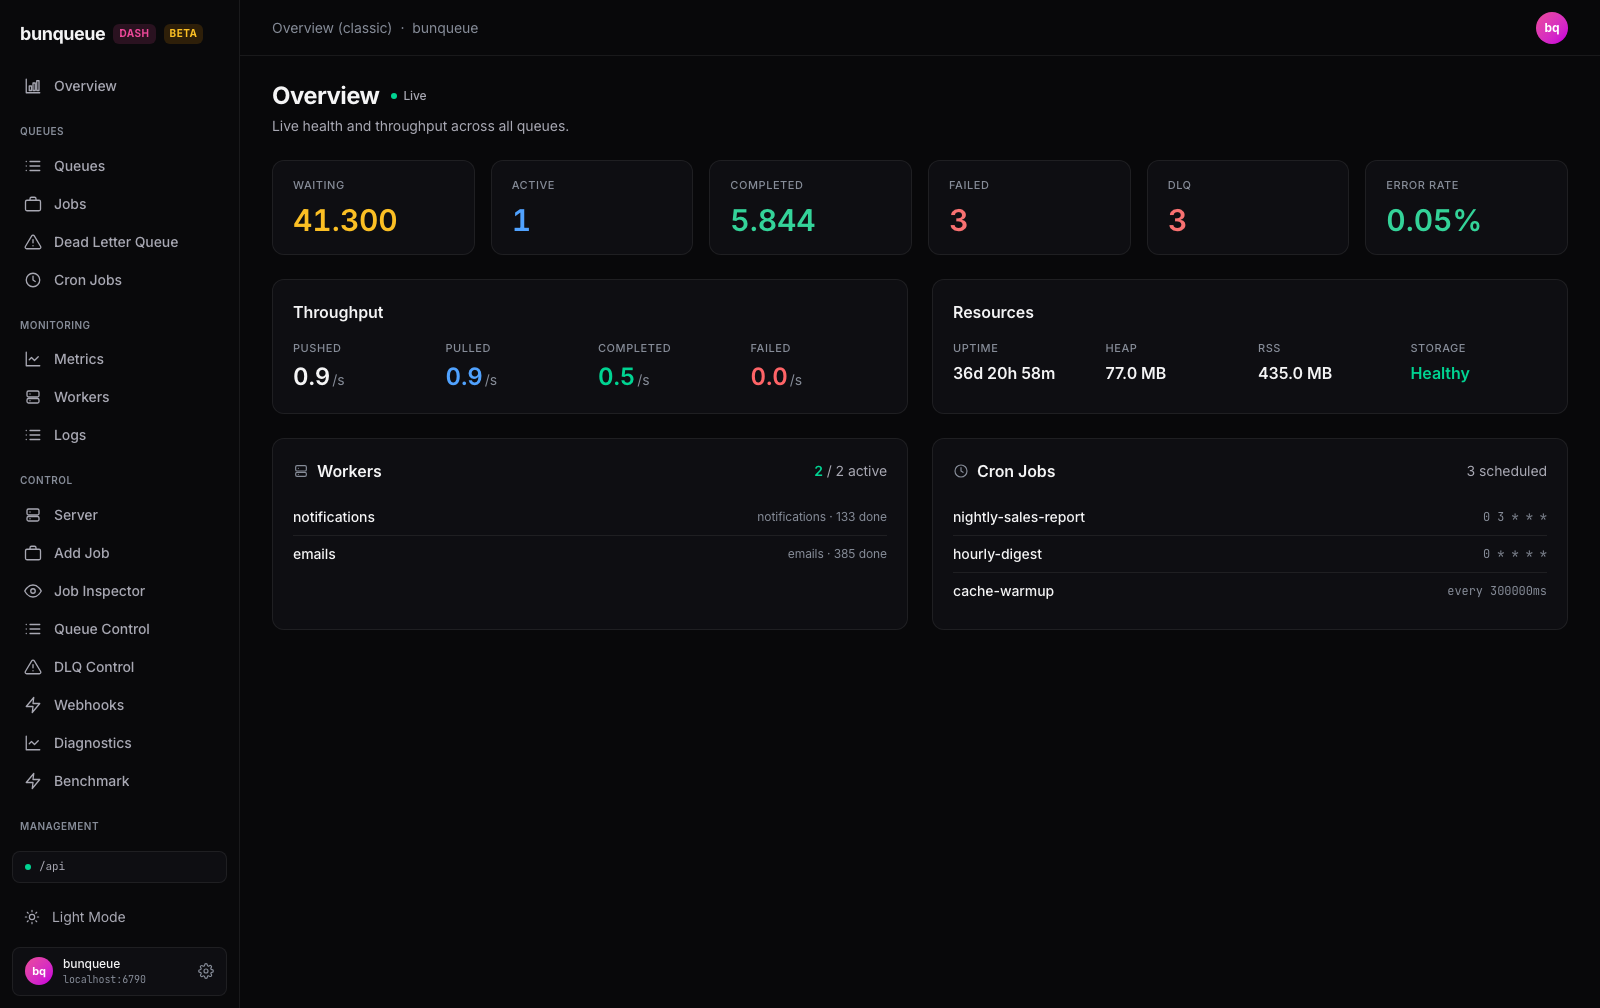
What it shows. A single-poll health summary of the whole bunqueue server: six stat cards (Waiting, Active, Completed, Failed, DLQ, Error Rate, DLQ and Error Rate turn red when non-zero / above 5%), a Throughput card with pushed/pulled/completed/failed rates per second, a Resources card (uptime, heap, RSS, and a Healthy/Disk-full storage flag), plus compact Workers and Cron Jobs lists (first 6 of each). In the screenshot the seeded server has 41,300 waiting jobs, two active workers (emails, notifications) and three crons (nightly-sales-report, hourly-digest, cache-warmup). Read-only, everything comes from one polled api.overview() call to the bunqueue HTTP API.
Differences vs the Pro page (/): OverviewPro adds a connection banner, a per-queue health grid, and a live Recent Activity feed.
Uptime converts the server's millisecond counter before formatting, matching the Pro overview.
Queues (classic)
Route
/queues-classic· sourcesrc/pages/Queues.tsx
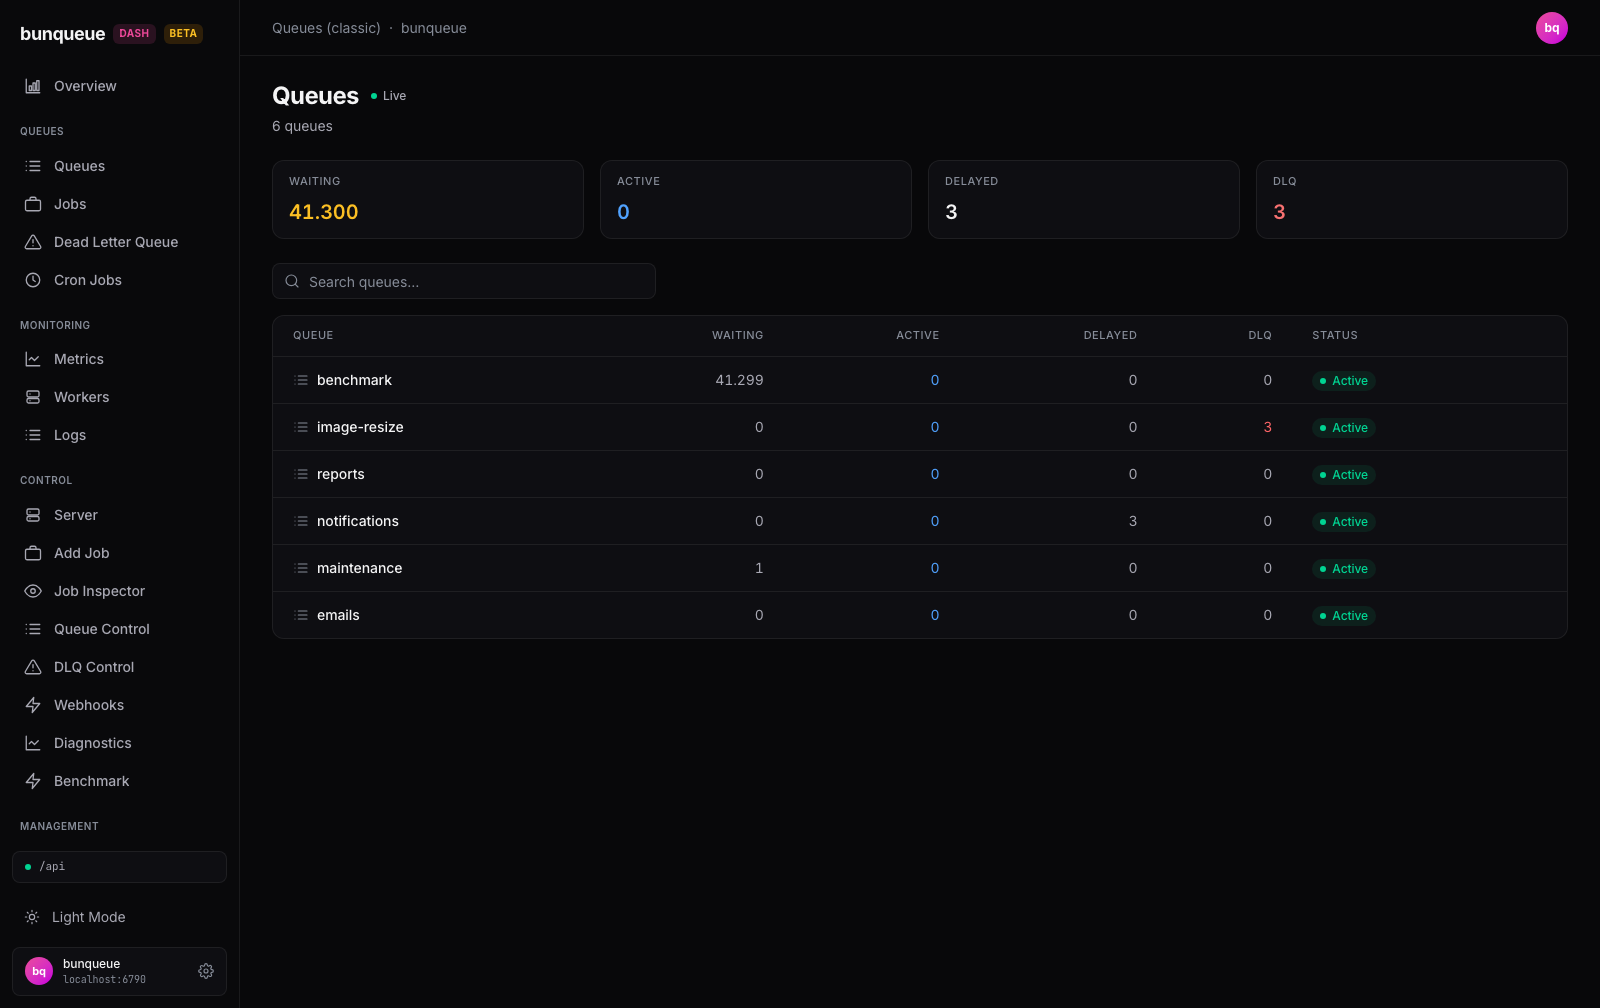
What it shows. A live-polled, read-only list of every queue on the bunqueue server, 20 per page. Four stat cards summarize Waiting / Active / Delayed / DLQ counts; below them, each row shows the same counts per queue plus an Active/Paused badge, in the screenshot, six seeded queues (benchmark with 41,299 waiting, image-resize with 3 DLQ entries in red, reports, notifications with 3 delayed, maintenance, emails), all Active. The search box filters by name, and clicking any row drills into /queues/:name (QueueDetail). There are no actions here, pausing, draining, and limits live in Queue Control.
Differences vs the Pro page: /queues (QueuesOverview) fetches the full list in one bq.queuesSummary() call and adds inline pause/resume; this classic page is paginated and read-only.
The search filters the current 20-row page; the header cards use global dashboard totals and therefore remain stable while paging.
Jobs (classic)
Route
/jobs-classic· sourcesrc/pages/Jobs.tsx
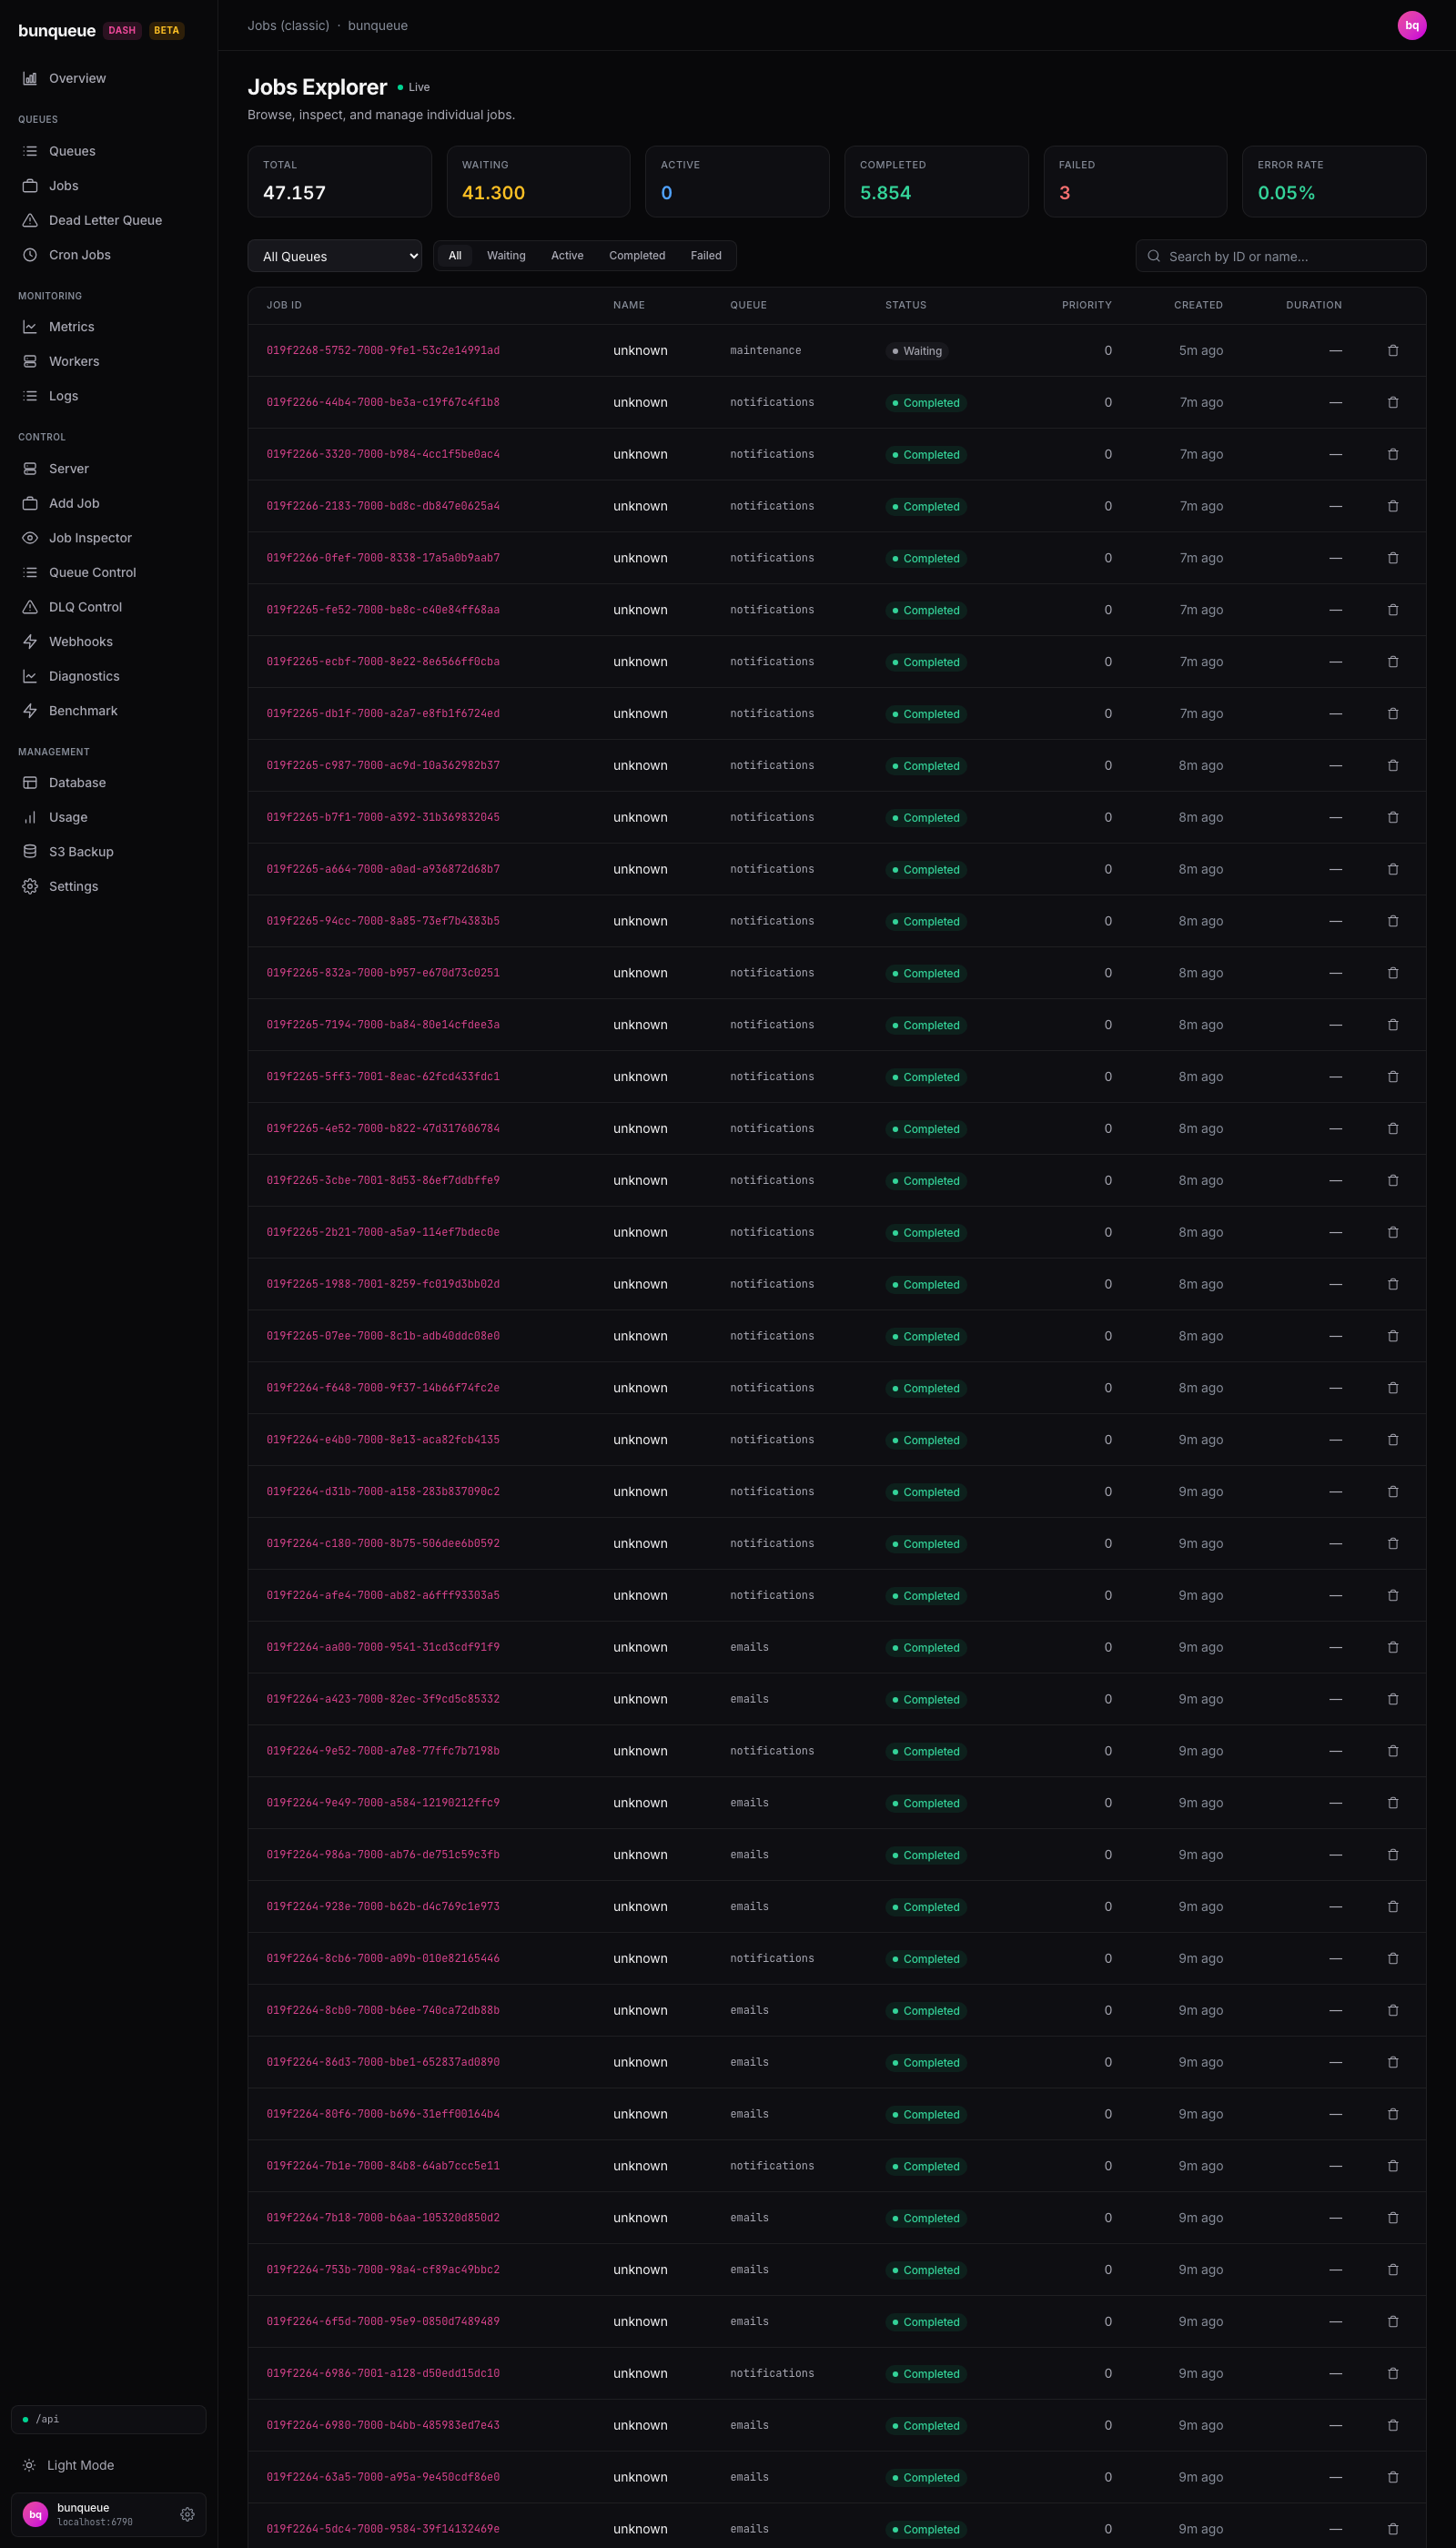
What it shows. A cross-queue job explorer over the bunqueue HTTP API: six stat cards above a merged job table. Filter with the queue dropdown and the All/Waiting/Active/Completed/Failed segments or search by job ID. Cancel is deliberately unavailable because the server cannot inspect hidden reverse flow dependencies. "All Queues" is available for up to 100 discovered queues and displays the newest 100 jobs. Above that threshold the page makes no job-list requests and asks you to select a queue, avoiding a 10,000-request periodic fan-out. Each bounded load pins one server/token and is cancelled when the view or connection changes; arriving via ?queue= preselects a queue.
The optional Name value comes from job.data.name, Duration uses the server's startedAt/completedAt timestamps. Non-string data.name values are ignored instead of crashing the table. The queue picker refreshes every 30 seconds.
Differences vs the Pro page: /jobs (JobsPro) is the replacement, single-queue, server-paginated, with multi-select bulk actions and correct Name/Duration.
DLQ (classic)
Route
/dlq-classic· sourcesrc/pages/Dlq.tsx
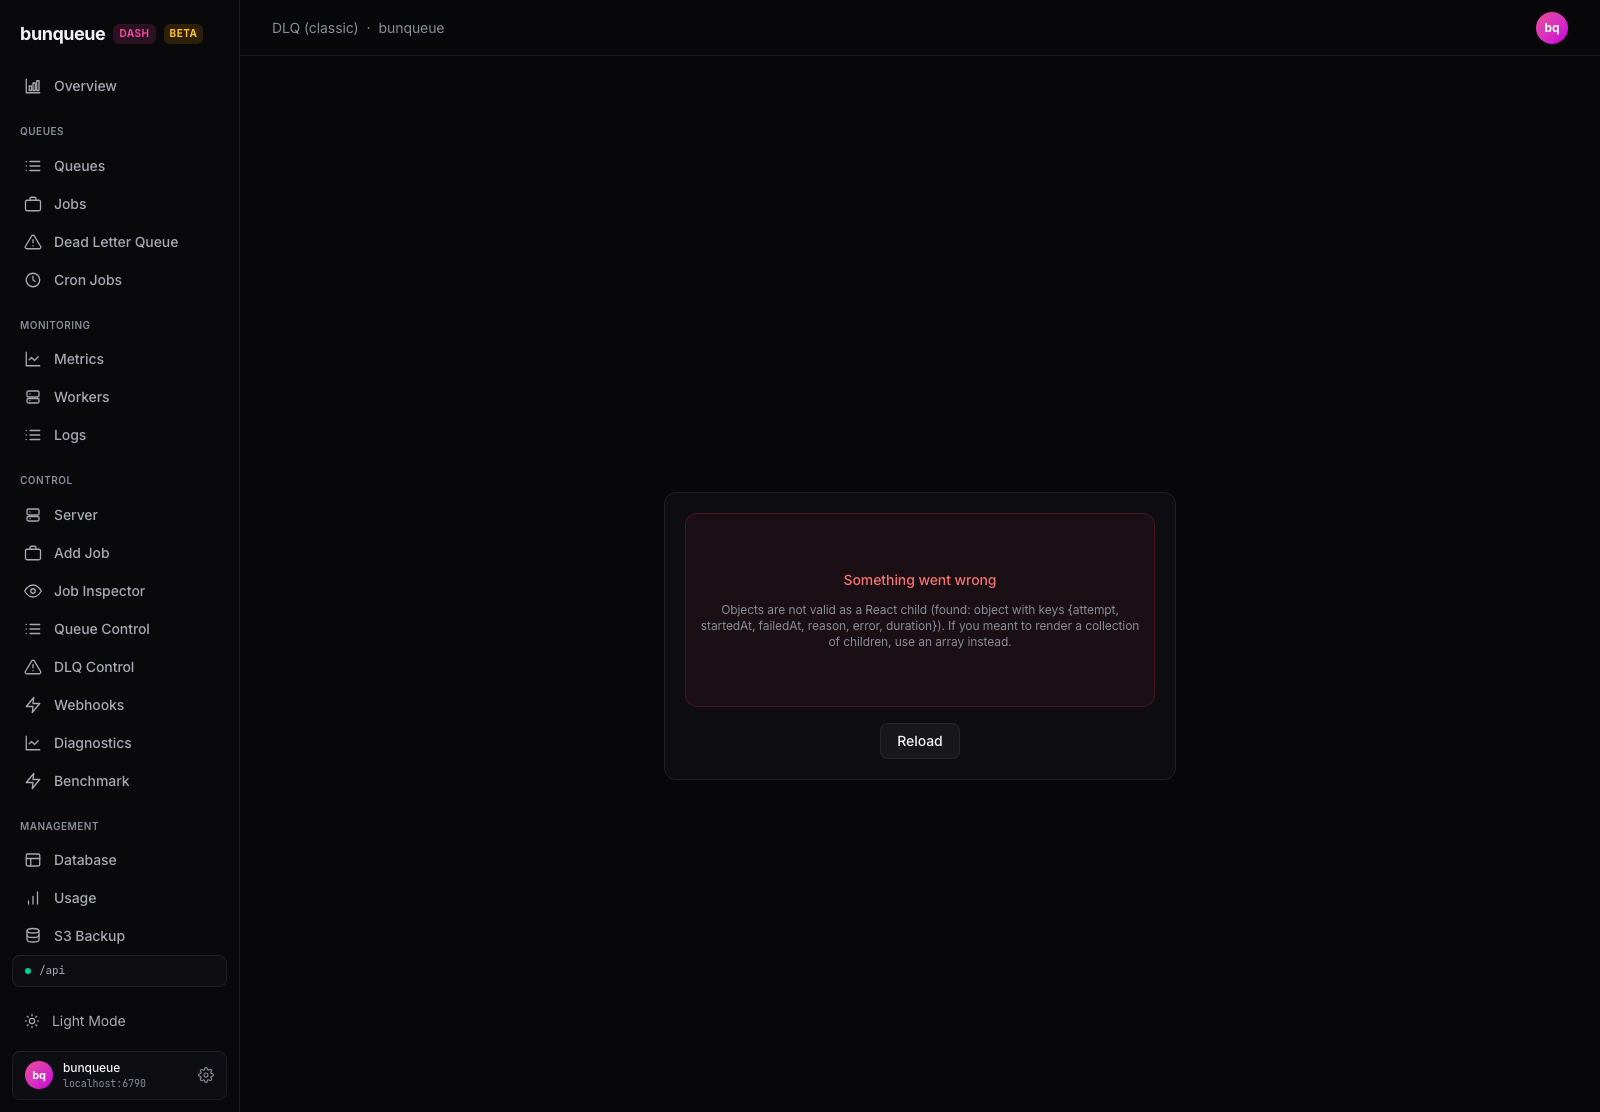
What it shows. The first-generation dead-letter view: a queue selector (with per-queue DLQ counts), a "DLQ Entries" stat card, a paginated entries table (Job ID, Name, Reason, Attempts, Failed), and Retry all / Purge buttons that remain disabled by the same flow-safety policy. It polls the bunqueue HTTP API via the legacy api client.
The client and table use the server's nested { job, enteredAt, reason, attempts[] } shape, including the nested job id, attempt count and latest failure time.
Differences vs the Pro pages: use /dlq (DlqPro, cross-queue filters plus CSV export) or /dlq-control (focused single-queue inspection). Both read the correct nested shape; every row/bulk/queue-wide retry control is disabled by the v2.9.3 atomicity policy.
Cron (classic)
Route
/cron-classic· sourcesrc/pages/Cron.tsx
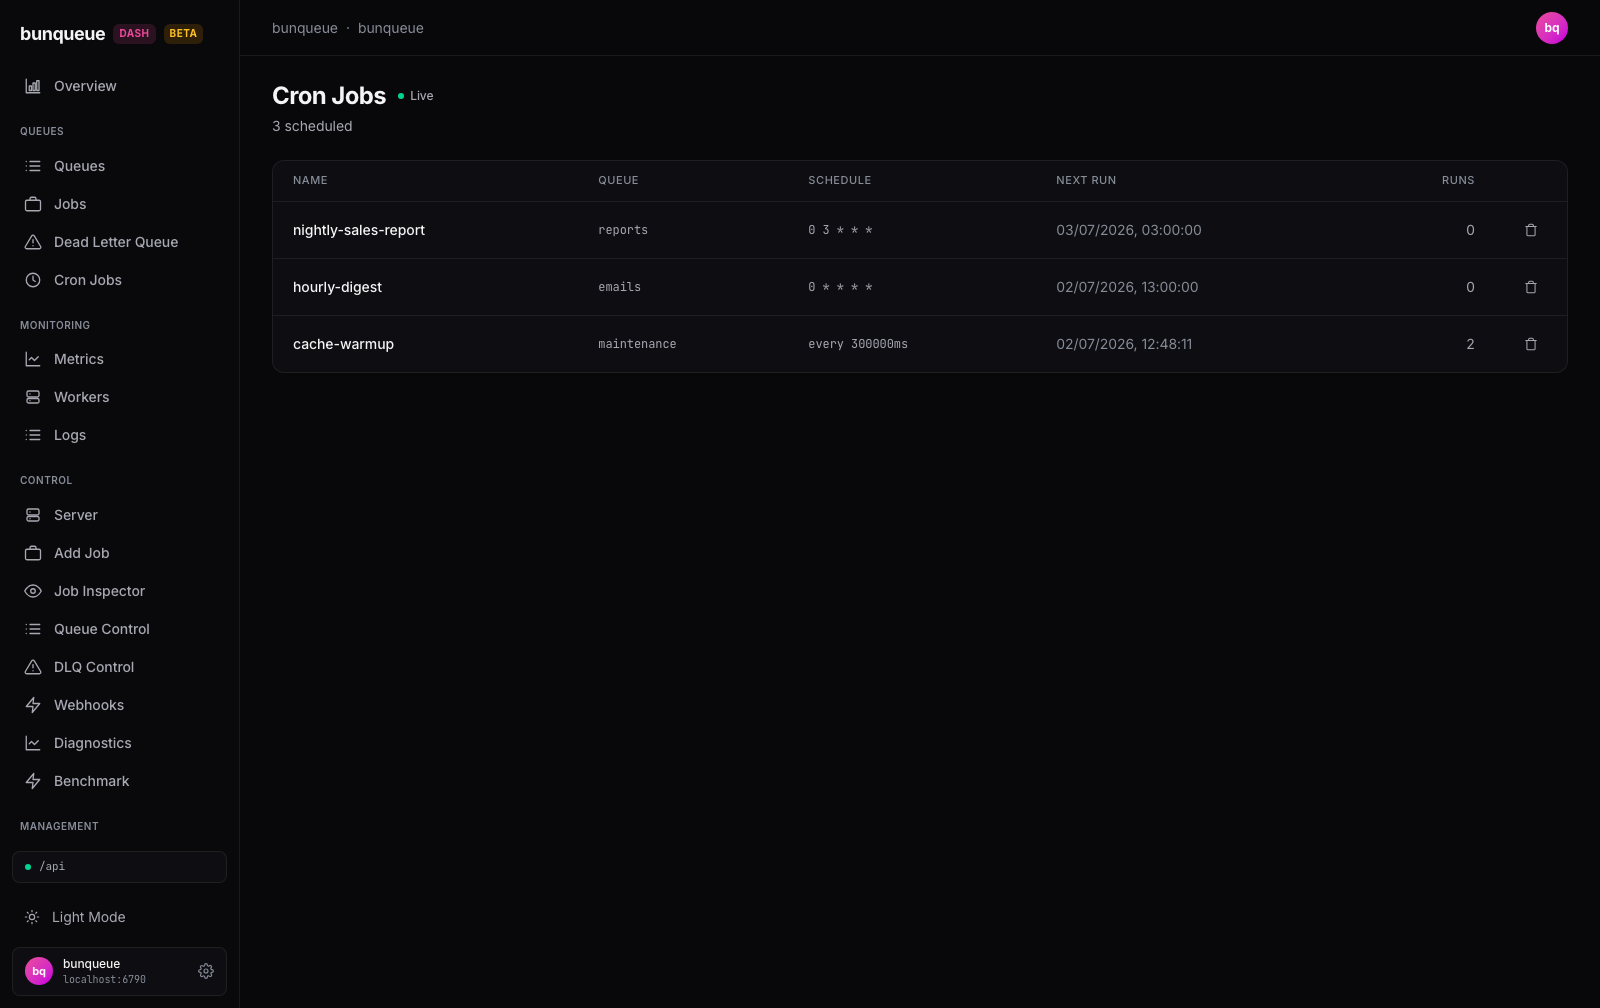
What it shows. A live-polling, read-only list of every scheduled job on the bunqueue server, paginated 15 per page. Each row shows the schedule's name, target queue, its trigger, a cron expression or an interval (every 300000ms), the next run time, and how many times it has executed. In the screenshot three schedules are registered: nightly-sales-report on the reports queue (0 3 * * *), hourly-digest on emails (0 * * * *), and cache-warmup on maintenance every 5 minutes (2 runs so far). The only action is the trash icon, which deletes a schedule after a confirmation prompt; if the server is unreachable an offline banner appears with a retry button.
Differences vs the Pro page. This page is list + delete only, creating schedules lives in Cron Manager. No known bugs; the classic/Pro duplication is intentional.
Metrics (classic)
Route
/metrics-classic· sourcesrc/pages/Metrics.tsx
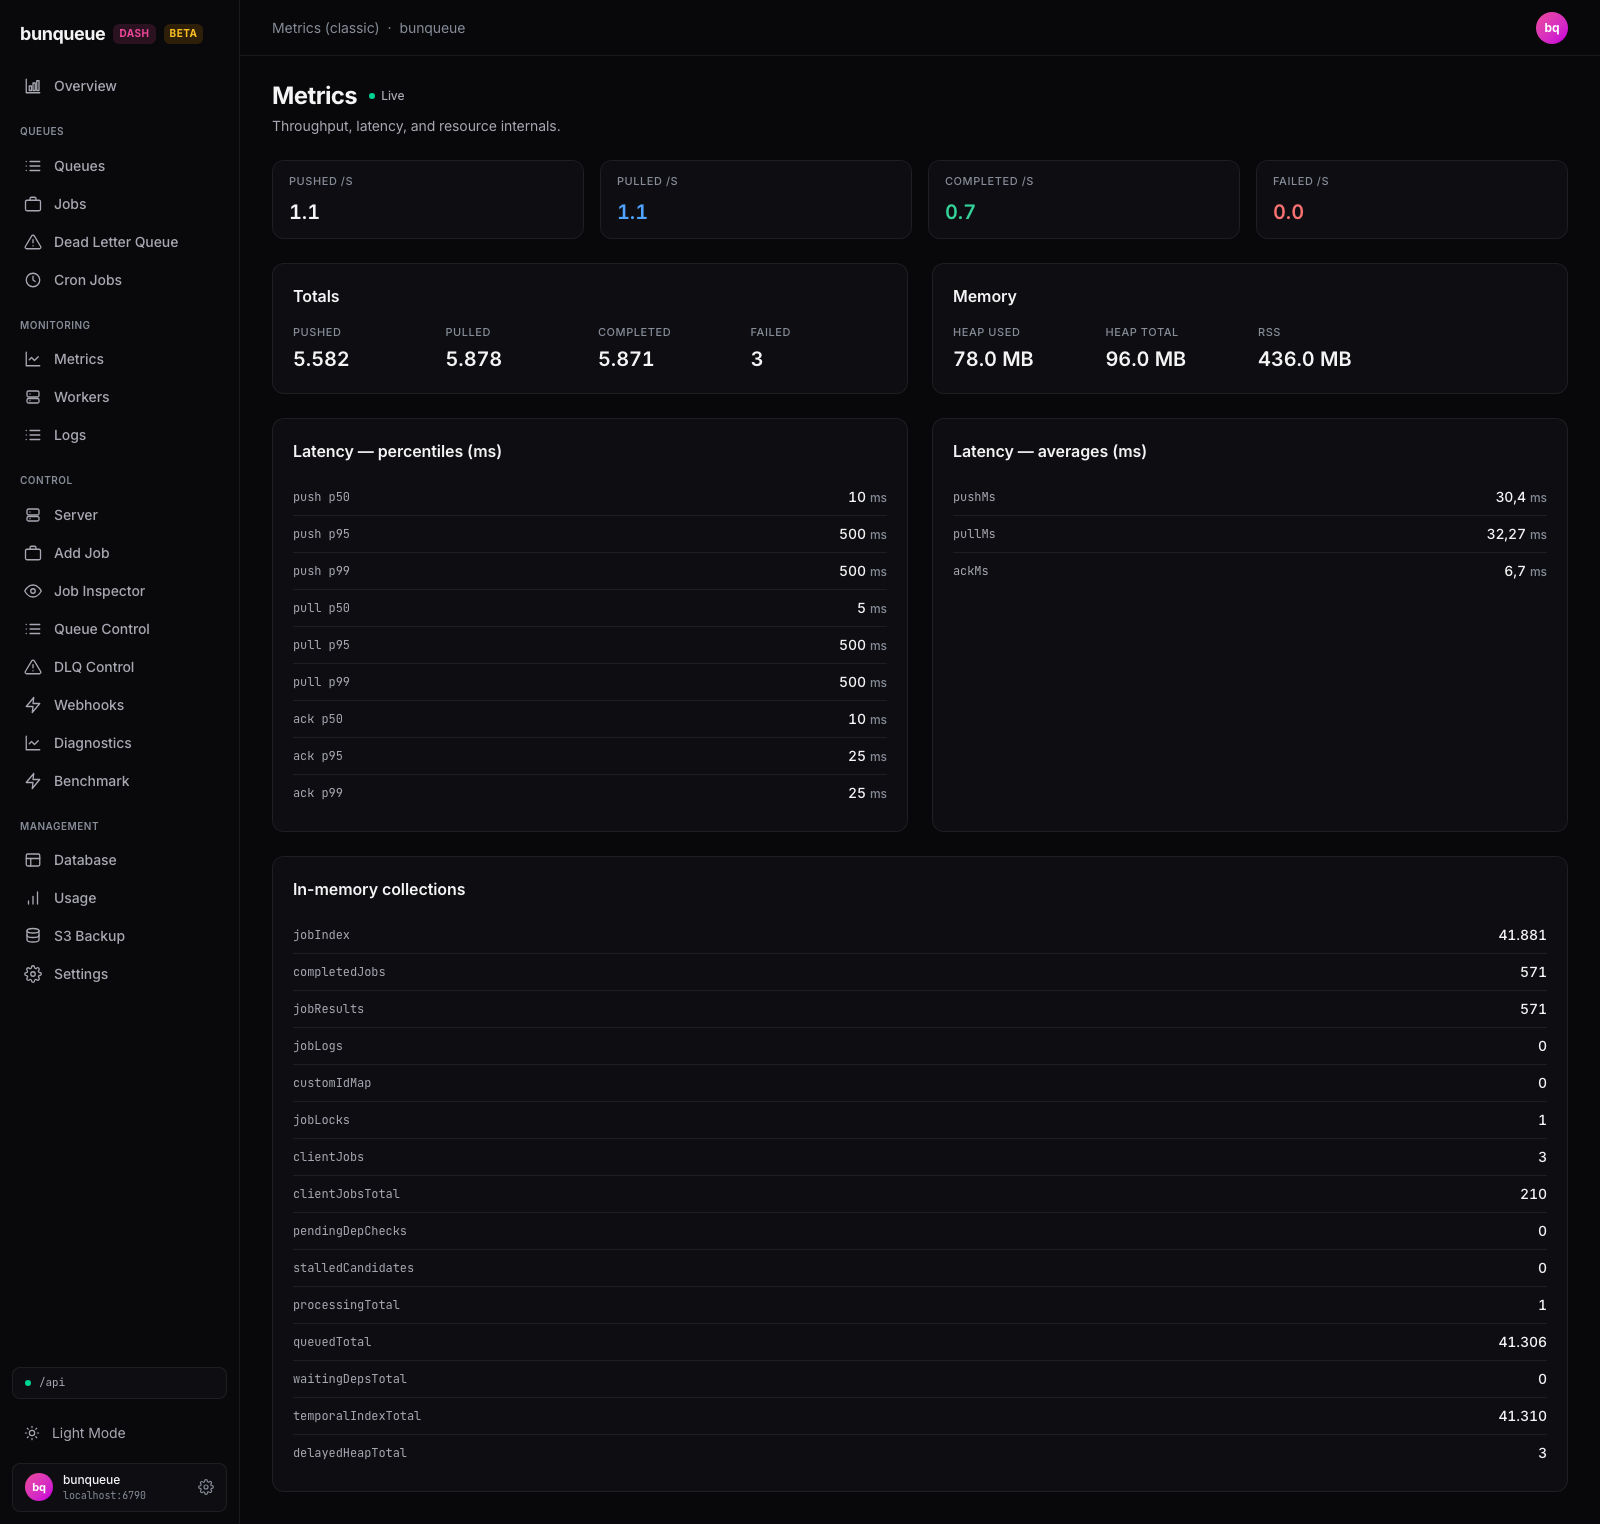
What it shows. A read-only, auto-refreshing dump of the raw GET /dashboard payload from the bunqueue API. The top row is live throughput per second (Pushed/Pulled/Completed/Failed, 1.1 / 1.1 / 0.7 / 0.0 in the screenshot). Below sit lifetime Totals (5,582 pushed, 5,871 completed, 3 failed across the seeded emails/image-resize/reports/notifications/benchmark workload), server Memory (heap 78/96 MB, RSS 436 MB), latency percentiles per operation (push/pull/ack × p50/p95/p99), latency averages (pushMs/pullMs/ackMs), and the server's in-memory collections (jobIndex 41,881, queuedTotal 41,306, …). Nothing is clickable; it refreshes at the global polling interval from Settings.
Differences vs the Pro page: /metrics (MetricsPro) adds a rolling 60-second throughput chart, a success-rate gauge, and per-queue counts, this page is flat key-value lists only.
Note: the percentile list once rendered broken values ([object Object]/zeros); per Known issues it now correctly flattens the nested per-operation percentiles.
Workers (classic)
Route
/workers-classic· sourcesrc/pages/Workers.tsx
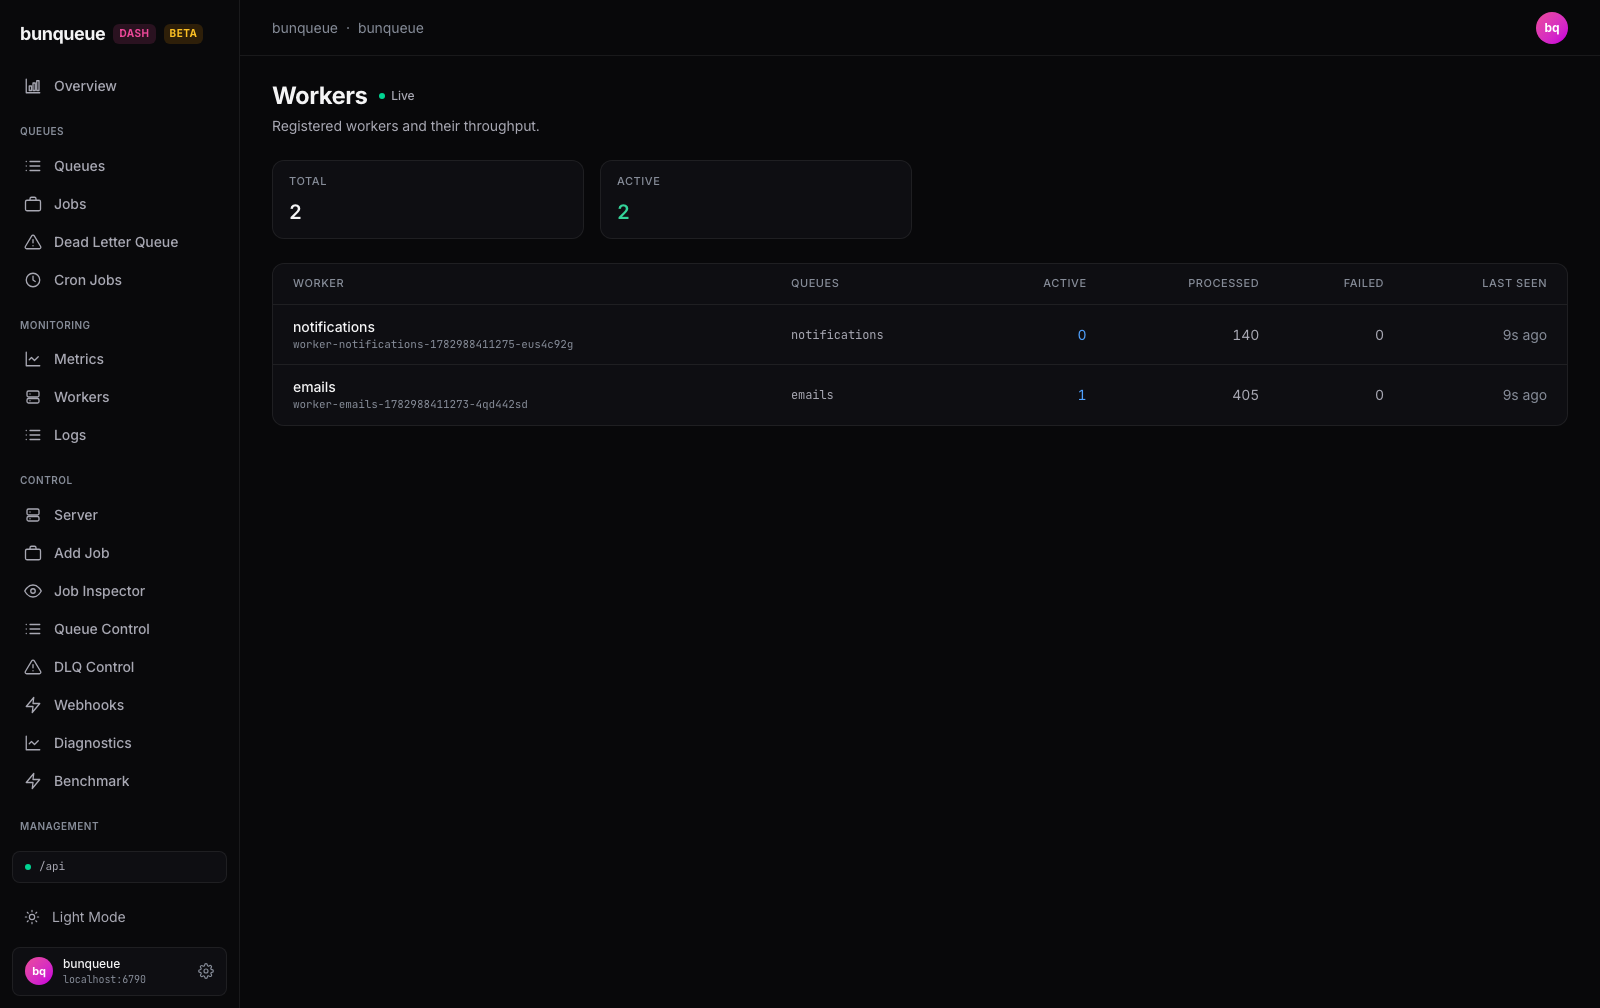
What it shows. A live, read-only table of every worker registered with the bunqueue server, polled via the same api.overview() call the classic Overview uses. Two stat cards summarize Total and Active counts (2 / 2 in the screenshot). Each row lists the worker's name and full ID (here notifications and emails workers from the seeded demo), the queues it consumes, and its Active / Processed / Failed job counts plus a relative "Last Seen" timestamp (9s ago). The list is client-paginated at 20 rows; if the server truncates the list at 100 workers, an amber "showing first N of M" hint appears. Nothing here is clickable, the page is purely for monitoring throughput.
Differences vs the Pro page: /workers (WorkersPro) adds an active/stale status indicator and guarded registry cleanup for stale, idle records. The action does not stop worker processes.
Logs (classic)
Route
/logs-classic· sourcesrc/pages/Logs.tsx
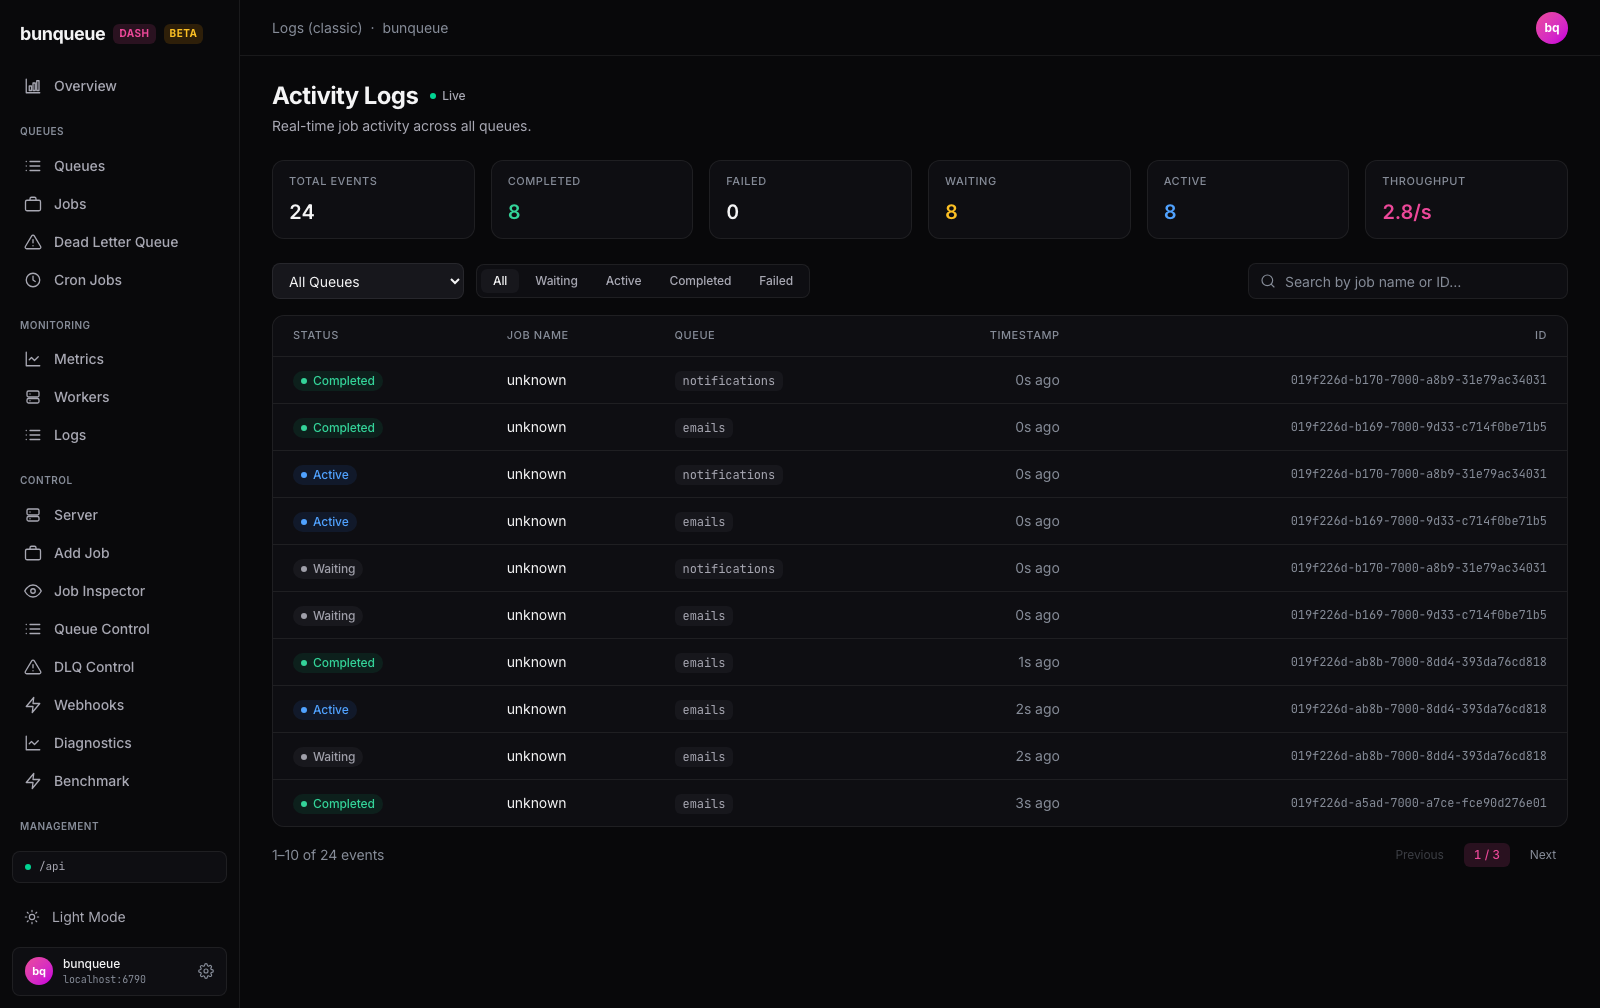
What it shows. A live activity feed of job events streamed over SSE from the bunqueue API, the same stream the Pro Logs page uses. Six stat cards count events since the page opened (Total, Completed, Failed, Waiting, Active) plus a rolling Throughput rate (2.8/s in the screenshot). Below, a table lists each event's status badge, event type, queue, relative timestamp, and job ID, 10 per page. Filter with the queue dropdown (list refreshed every 30 s), the All/Waiting/Active/Completed/Failed segments, or the search box (matches job ID or queue). In the screenshot, seeded emails and notifications jobs cycle through Waiting → Active → Completed. Counters reset on reload, this is a session view, not history.
Differences vs the Pro page: /logs adds richer failure details plus export/clear controls; both views use event type because SSE events do not carry job names.
Usage (classic)
Route
/usage-classic· sourcesrc/pages/Usage.tsx
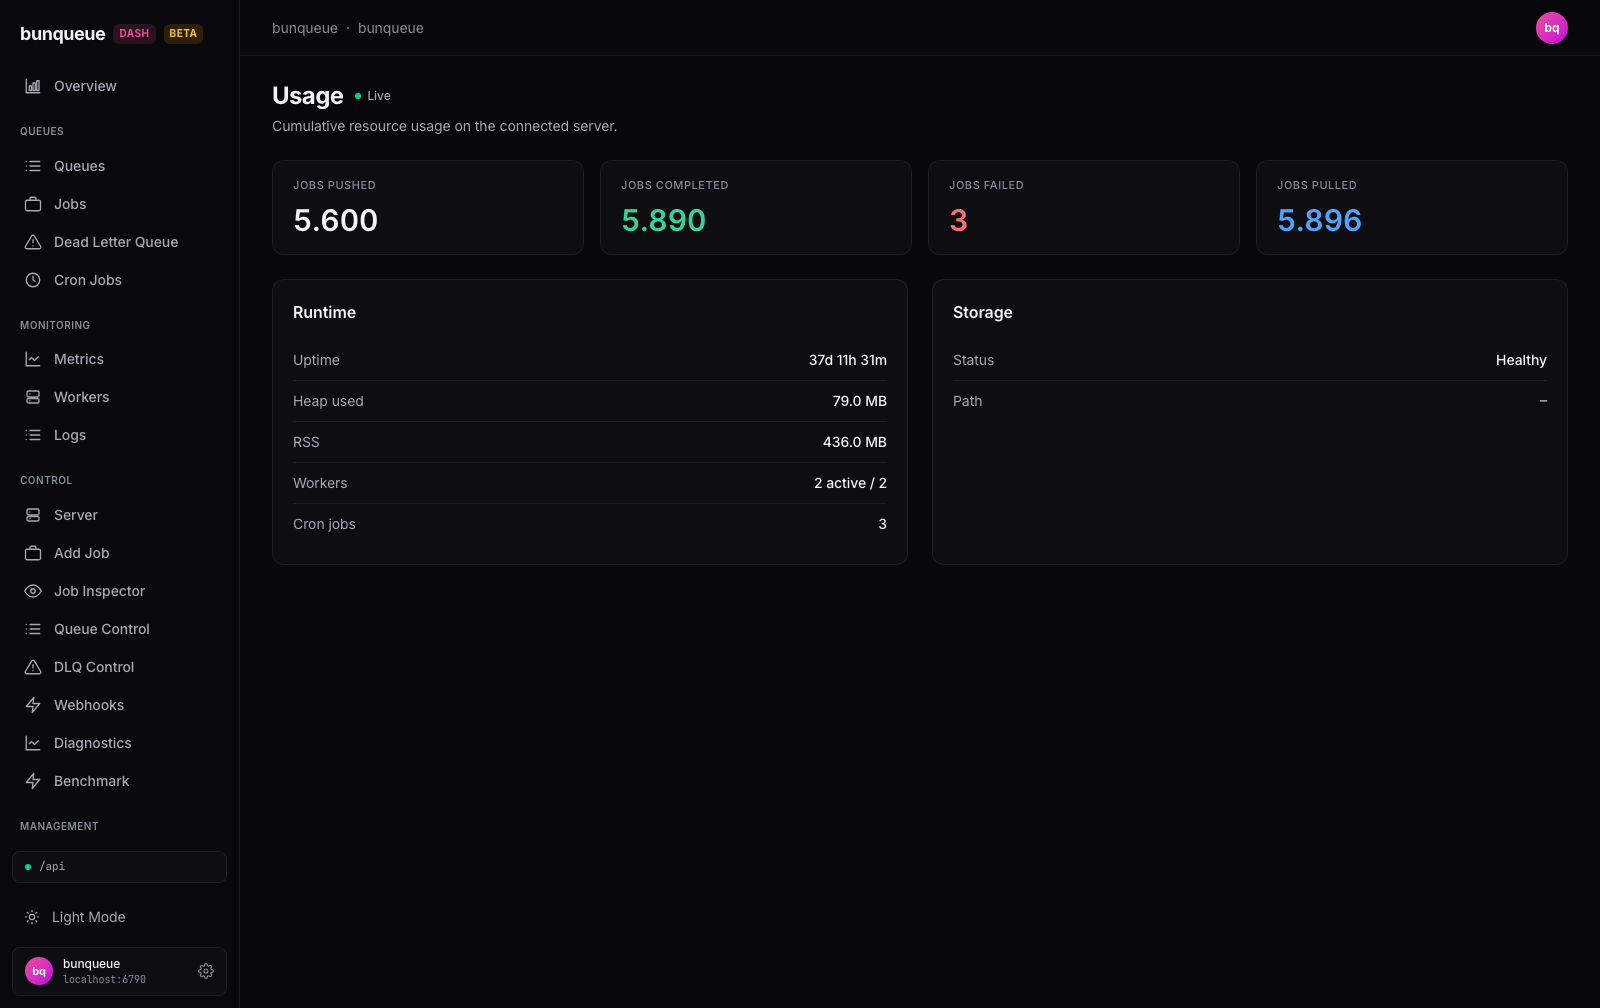
What it shows. A read-only snapshot of cumulative server usage, polled live from the bunqueue HTTP API via a single api.overview() call. Four stat cards give lifetime totals, in the screenshot the seeded demo workload shows 5,600 jobs pushed, 5,890 completed (green), 3 failed (red), 5,896 pulled (blue). Below them, a Runtime card lists uptime, heap used (79.0 MB), RSS (436.0 MB), workers ("2 active / 2") and cron jobs (3), and a Storage card shows honest disk-full state and when it began. There is nothing to click; if the server is unreachable the page renders zeroed values with an offline banner instead of an error.
Differences vs the Pro page: /usage (UsagePro) adds an error-rate figure and a more prominent storage warning.
S3 Backup (classic)
Route
/s3-classic· sourcesrc/pages/S3Backup.tsx
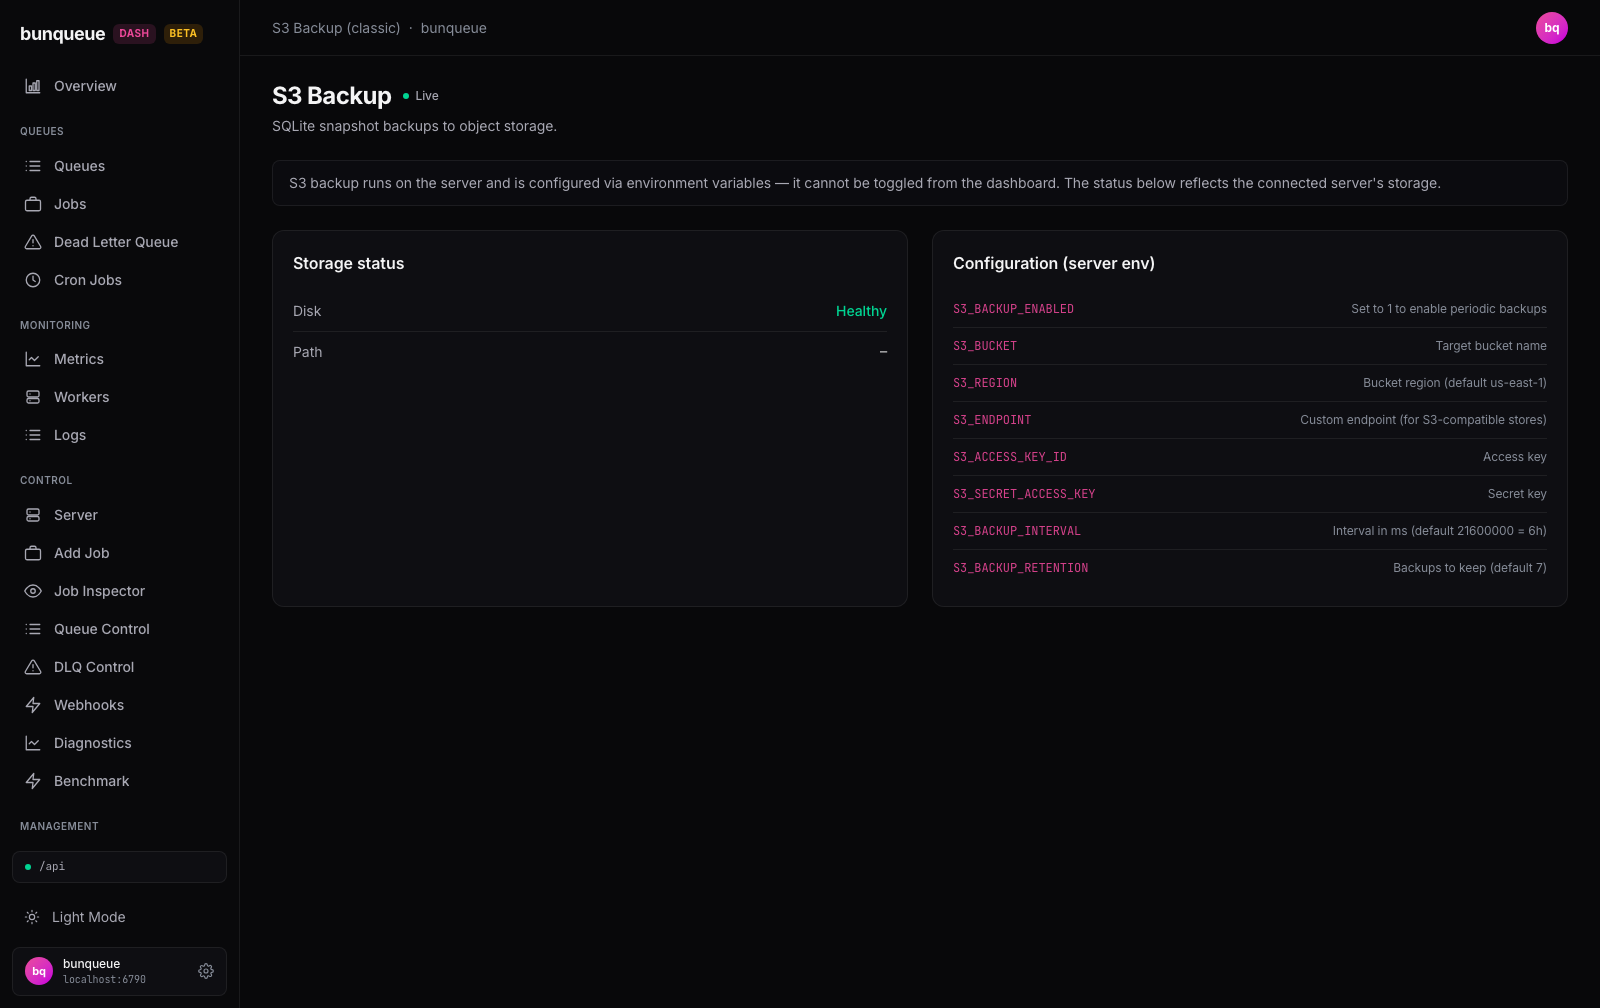
What it shows. A read-only reference for bunqueue's S3 snapshot backups. A banner reminds you that backups are configured on the server via environment variables and cannot be toggled from the dashboard. Two cards follow: Storage status (polls GET /storage on the bunqueue API and reports Disk plus any server Error) and Configuration (server env), a static cheat-sheet of the eight variables that actually control backups (S3_BACKUP_ENABLED, S3_BUCKET, S3_REGION, S3_ENDPOINT, access/secret keys, S3_BACKUP_INTERVAL, S3_BACKUP_RETENTION) with defaults. There is nothing to click, use it as a lookup while editing your server's env.
Differences vs the Pro page: /s3 (S3BackupPro) adds the environment builder and live agent-backed status, object listing, on-demand backup, and guarded restore operations. This classic page remains a read-only reference.
Not found (404)
Route
*· sourcesrc/pages/NotFound.tsx
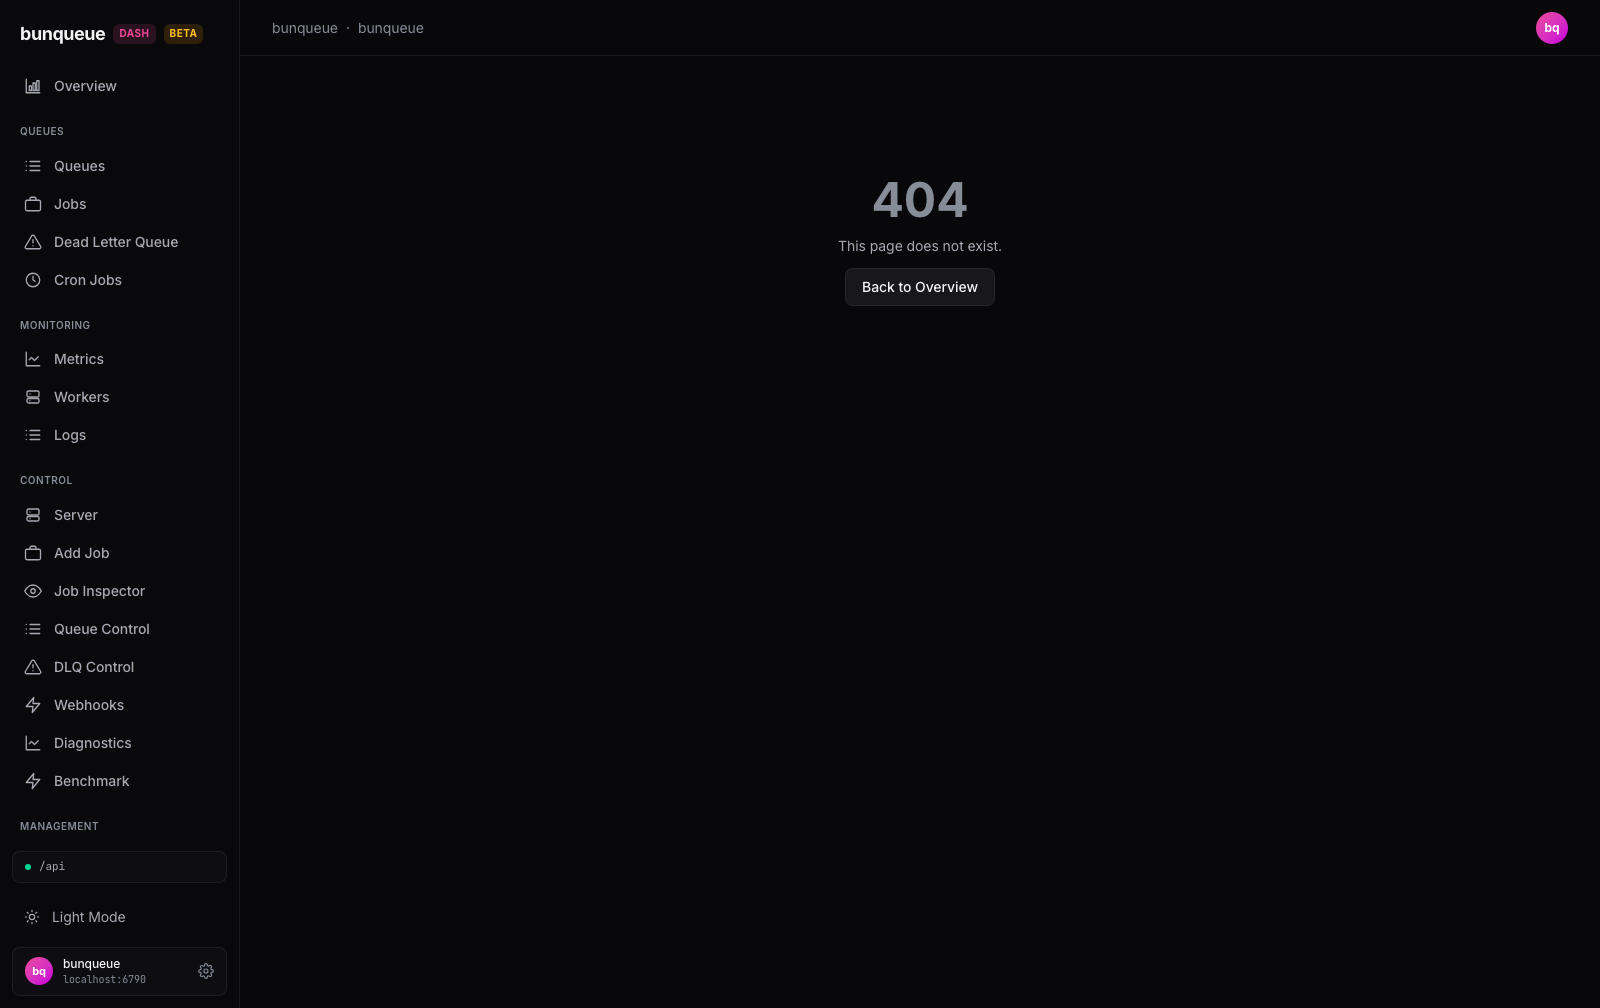
Any unknown path renders this catch-all inside the normal layout shell, the sidebar stays usable and a Back to Overview button returns to /. Note the Topbar falls back to a generic "bunqueue · bunqueue" title here, as it does for every route missing from its title map (see Known issues).