
Overview
A single screen that shows, at a glance, whether your bunqueue server is healthy and what your queues are doing right now.
Where: Home (the landing page).
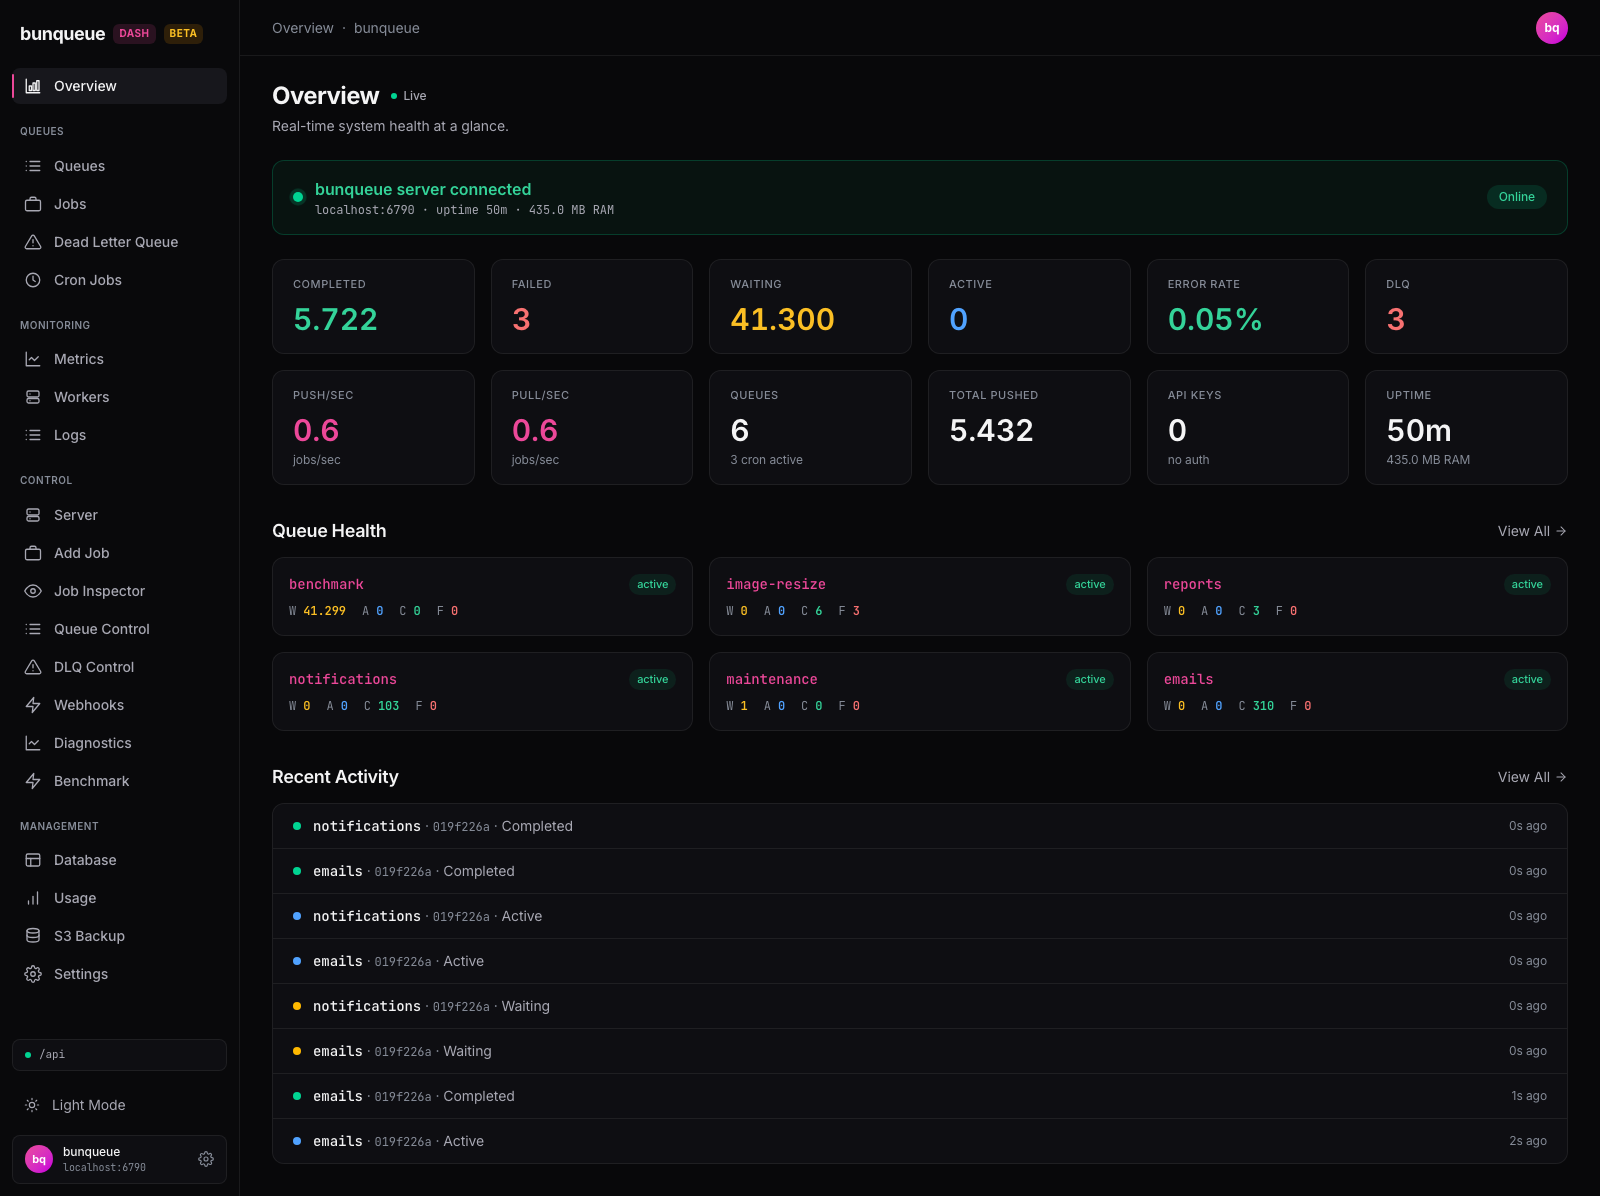
What you'll see
At the top, a wide banner tells you if the dashboard is connected. Below it are two rows of headline numbers, a grid of your busiest queues, and a live feed of recent job events. Everything updates on its own, you don't need to refresh.
Connection banner
| State | What it means |
|---|---|
| Green dot · "bunqueue server connected" · Online | The latest check reached the server; the numbers are fresh. |
| Amber dot · "Connection lost, showing last known data" · Stale | The latest check failed; you're seeing the last numbers received, which may be a little old. |
The line under the banner always shows the server address, how long it's been running (uptime), and how much memory it's using.
Health row
| Element | What it tells you |
|---|---|
| Error Rate | Recorded failed jobs divided by recorded processed jobs; unknown with no sample, red above 5%. |
| Failed | Current failed jobs summed across queues. |
| DLQ | Current dead-letter entries. |
Throughput and inventory row
| Element | What it tells you |
|---|---|
| Completed | Retained completed jobs. |
| Active | Jobs being processed now. |
| Ready backlog | Waiting plus prioritized jobs across queues. |
| Push/sec / Pull/sec | Current rates, with process-session totals labelled since restart. |
| Queues | Queue count, with active cron count beneath it. |
Uptime and memory appear in the connection banner. There is no API Keys card.
Queue Health — most loaded shows up to six queues ranked by failed jobs, then ready backlog (waiting plus prioritized), rather than arbitrary list order. Each card links to its queue detail. Missing values use a dash (—).
Recent Activity, a live feed of the last few job events, each with a colored status dot, the queue, a short job ID, the status, and how long ago it happened.
What you can do
This screen is for watching, not changing, there are no destructive actions here. You can:
- Open a queue, click any Queue Health card to jump into that queue's details.
- See all queues, click View All next to Queue Health.
- See the full activity log, click View All next to Recent Activity.
- Reconnect, when the banner is amber, click Retry to check the server again right away.
Good to know
TIP
The screen refreshes on its own every few seconds. An amber "Stale" banner means only the last check failed, the server may still be up, and your numbers are simply a few seconds old. Click Retry to check again.
- Queue Health shows six queues. If you have more, use View All to see them. The Queues number still counts every one.
- Recent Activity starts empty. It fills as new events arrive and doesn't load past history. For the full picture, open the activity log via View All.
- A dash (—) means "not available yet," not zero.
For a plain-language list of current limits, see Known issues.
Under the hood (for developers)
- Uses the shape-verified
bqclient plus a shared activity-stream hook. - Polls two endpoints together,
GET /dashboardandGET /queues/summary, on the global refresh interval (default 3000 ms), with at most one request in flight. - Live events come from the
/eventsSSE stream (250-event ring buffer, ~150 ms flush, 2000 ms reconnect backoff). - Deliberately two requests per poll, not one-per-queue:
/queues/summaryalready carries every queue's counts.