
Usage
A single, read-only snapshot of how hard your bunqueue server is working, lifetime job totals, live queue counts, error rate, memory, uptime, and disk health.
Where: open /usage from the sidebar.
What you'll see
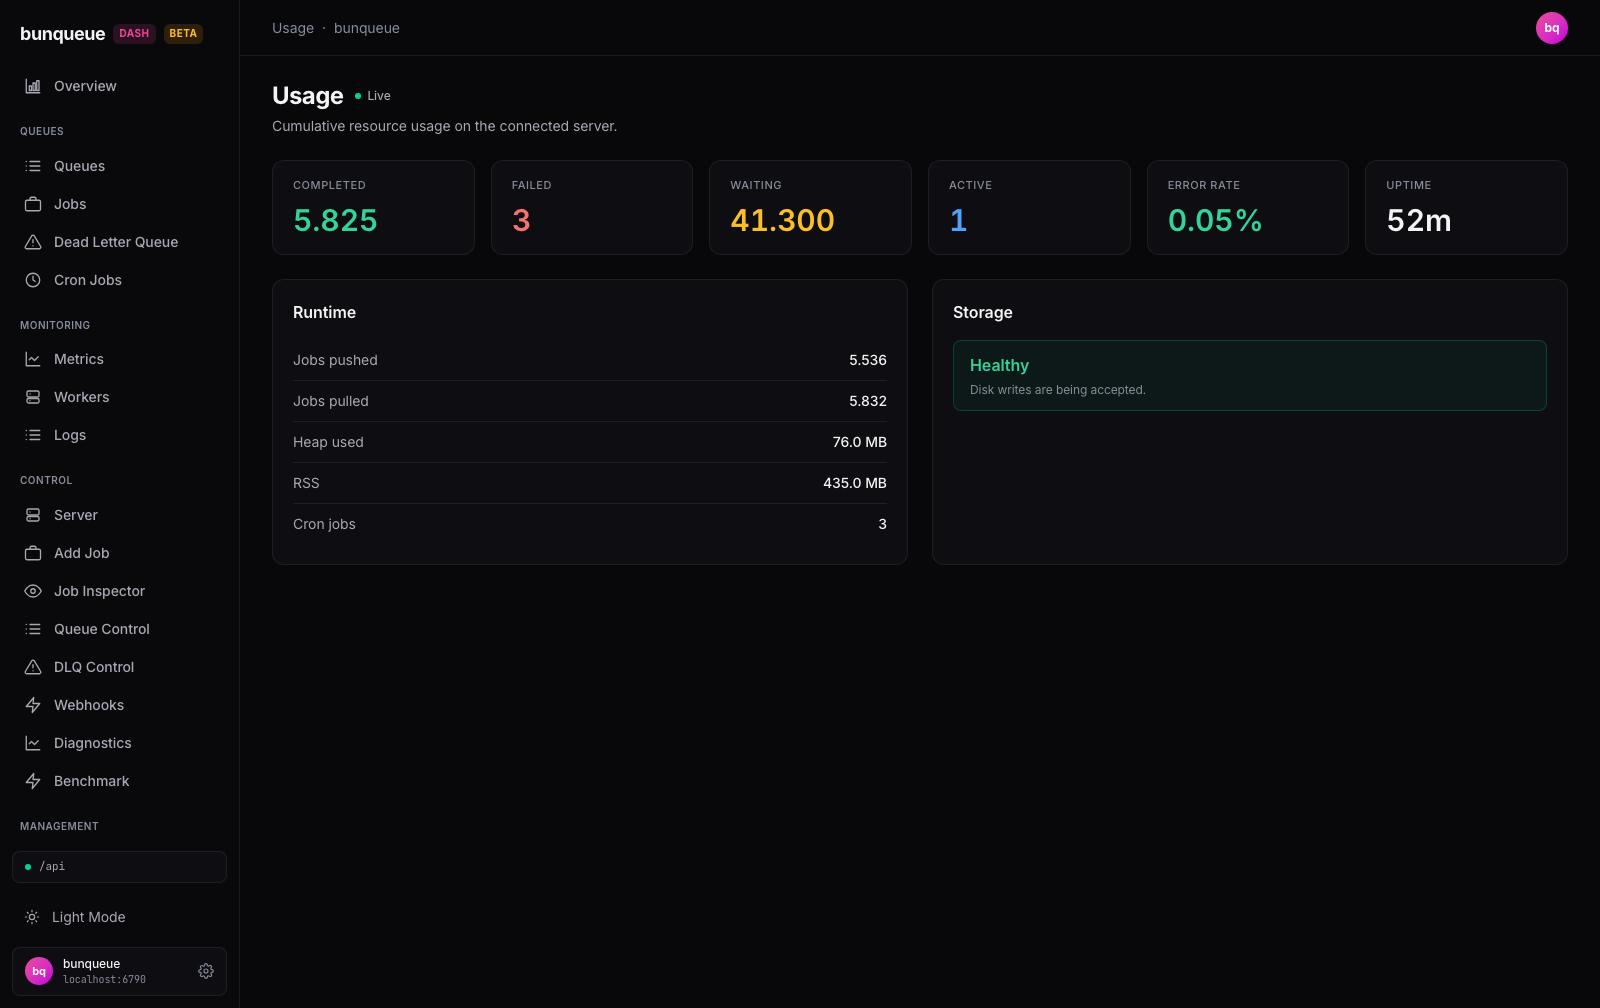
The page opens with a Live dot next to the title, that means everything on screen refreshes on its own. Below it sit six stat cards, then two detail cards: Runtime and Storage.
The six top cards:
| Card | What it tells you |
|---|---|
| Completed | Retained completed jobs reported by the dashboard snapshot. Always shown in green. |
| Failed | Current failed jobs summed across queue summaries. Turns red when the number is above zero. |
| Waiting | Jobs queued right now, waiting for a worker. Shown in amber. |
| Active | Jobs being processed at this very moment. Shown in blue. |
| Error Rate | Share of finished jobs that failed, as a percentage. Green when healthy, red once it passes 5%. |
| Uptime | How long the server process has been running. Shows a dash (—) if the server just started. |
The Runtime card breaks down the workload and process footprint:
| Row | What it tells you |
|---|---|
| Jobs pushed (since restart) | Process-session push counter. |
| Jobs pulled (since restart) | Process-session pull counter. |
| Heap used | Memory actively in use by the server process. |
| RSS | Total memory the process is holding. |
| Cron jobs | How many scheduled (cron) jobs are registered. |
The Storage card is a single health verdict:
- Healthy (green), "Disk writes are being accepted."
- Disk full, writes suspended (red), appears when the server can no longer write to disk. When available, it also shows the underlying error and how long ago writes stopped.
TIP
Large counts use your locale's thousands separator, so a value like 5825 may appear as 5,825 (or 5.825 in some locales).
What you can do
This screen is a dashboard, not a control panel, there are no buttons that change anything on the server.
- Watch totals climb live. Numbers update on their own as workers run; you never need to refresh.
- Spot trouble at a glance. A red Failed or Error Rate card, or a red Storage panel, is your signal to jump to DLQ Control, Queue Control, or the server host to investigate.
- Retry when offline. If the server can't be reached, a banner appears at the top with a Retry button that re-checks the connection.
Good to know
- It's read-only by design. Nothing here mutates the server, to act on failures, head to DLQ Control, Queue Control, or the server host.
- Uptime shows a dash, not
0m, when the server has just started or can't be reached. - If the server goes offline, an initial failure shows an error state. After a successful read, a refresh failure retains the last successful snapshot and labels it stale; missing storage data is not shown as a fresh healthy result.
- Counts have different lifetimes. Completed/failed cards describe retained queue state; pushed/pulled are explicitly labelled since restart. Cleanup and retention can change state totals. The classic appendix describes the older page.
- It's a focused summary. Latency charts, throughput, and the full worker and cron lists aren't shown here, use Metrics and Workers for those.
Under the hood (for developers)
- Uses the
bqclient (not the legacyapi). - Polls three endpoints in parallel each cycle:
GET /dashboard(job stats, memory in MB, cron count)GET /storage(disk-health flag, wrapped indata), andGET /queues/summary(failed counts). - Refresh cadence follows the global interval from Settings (default 3000 ms, floored at 500 ms). No SSE, pure polling, with change-detection to skip redundant re-renders.
/dashboardreportsuptimein milliseconds and memory in megabytes; the page converts both before display.