
Diagnostics
A single-glance health check for your bunqueue server, is it up, how long has it been running, is the disk full, what's connected, and how much memory is it using.
Where: open /diagnostics from the sidebar.
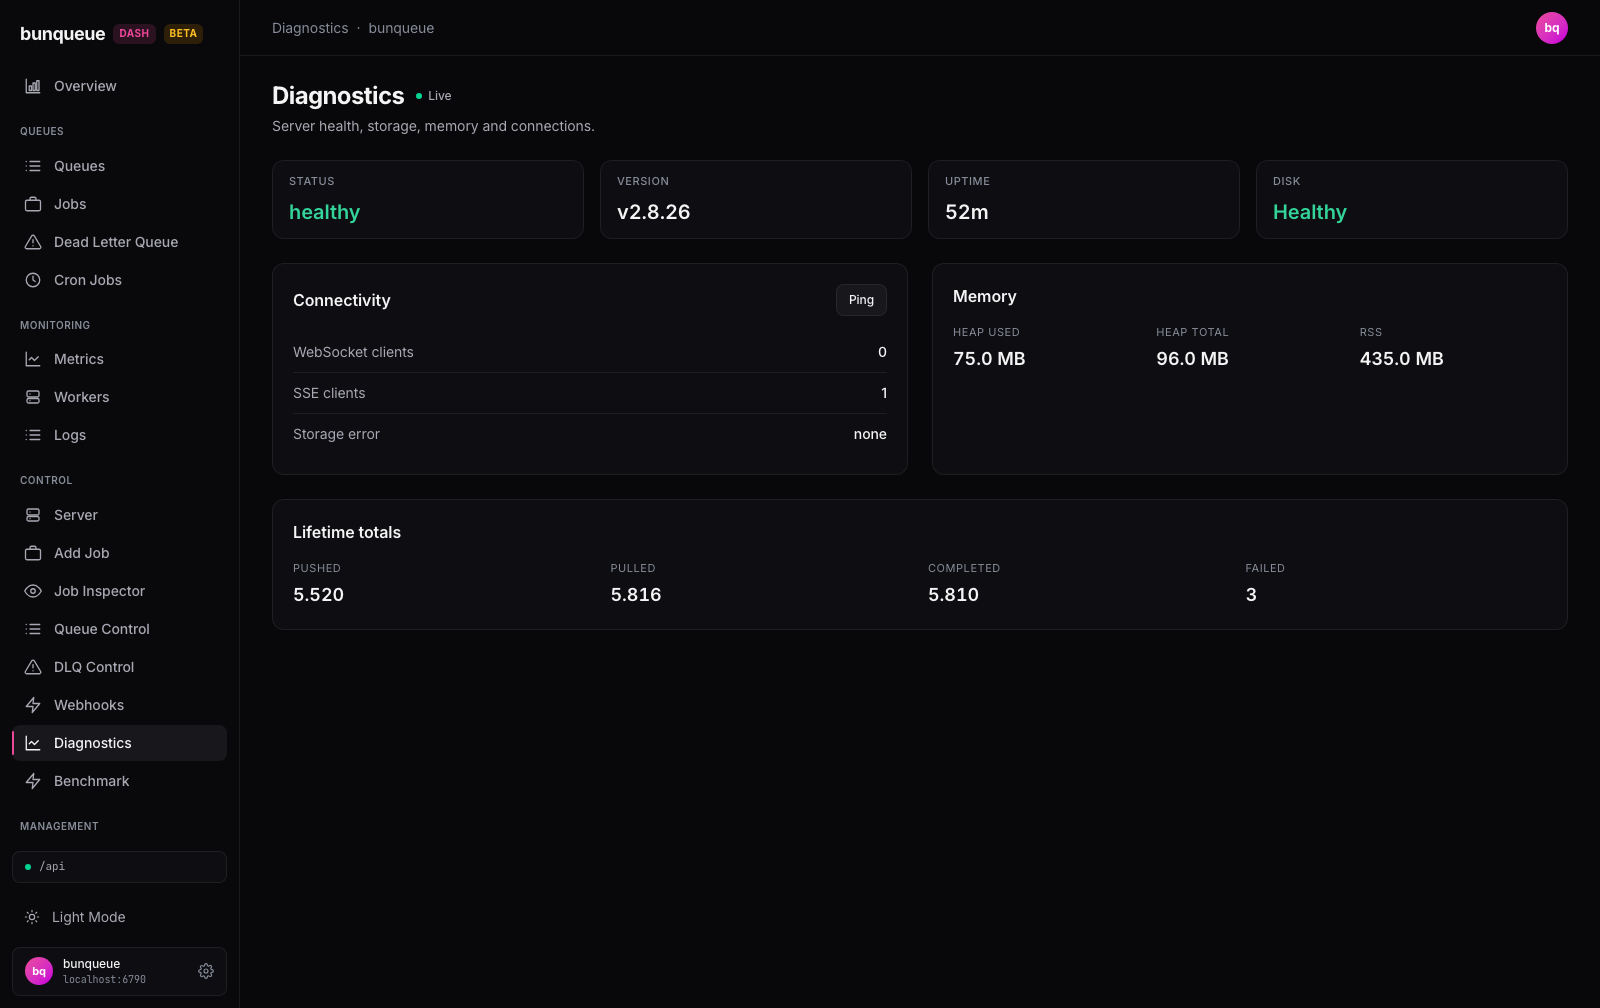
What you'll see
The page opens with a row of status cards across the top, two cards below it (Connectivity and Memory), and a Totals since restart card at the bottom. Everything updates on its own, this is your first stop whenever the dashboard feels off.
Status row
| Element | What it tells you |
|---|---|
| Status | The server's overall health. Green when healthy, red when degraded. |
| Version | The bunqueue server version (for example v2.9.3), or — if the server doesn't report one. |
| Uptime | How long the server has been running (for example 52m). |
| Disk | Healthy (green) normally, or Full (red) when the server is out of disk space. |
Connectivity
| Element | What it tells you |
|---|---|
| WebSocket clients | How many live WebSocket clients are attached to the server. |
| SSE clients | How many live Server-Sent-Events subscribers are attached. The dashboard's own live activity stream counts as one, so 1 is normal while the dashboard is open. |
| Storage error | The server's last storage error, or none when everything is fine. |
Memory
| Element | What it tells you |
|---|---|
| Heap used | Memory the server is actively using (for example 75.0 MB). |
| Heap total | Memory the server has reserved for its heap. |
| RSS | Total resident memory the server process is holding. |
Totals since restart
Process-session counters since the server restarted: Pushed (jobs enqueued), Pulled (jobs handed to workers), Completed (jobs finished), and Failed. This card only appears when the server reports these totals.
What you can do
Most panels inspect the server. Manual actions include memory operations:
- Ping (in the Connectivity card header), measures the round-trip time to the server and shows the result on the button (for example
Ping · 34 ms, orPing · unreachableif it can't reach the server). The result stays until you ping again. - Compact (GC) requests garbage collection and reports the before/after RSS difference, or that no memory was reclaimed. This affects the server process.
- Load / Refresh in Heap statistics requests object counts and top object types; the upstream endpoint forces GC before collecting them.
- Copy in Prometheus copies the current scrape URL.
- Retry, appears on the offline banner when the server can't be reached. Click it to re-check the server right away.
TIP
Ping latency is measured from your browser, so it includes the full network path between you and the server, treat it as an end-to-end reachability check, not the server's internal processing time.
Good to know
- An SSE count of
1is not a leak. The dashboard's own live activity stream registers as one SSE client, so expect at least1while the dashboard tab is open. - A degraded server still shows here. If the server is unhealthy (for example the disk is full), the Status and Disk cards turn red but the page stays live and keeps updating, you won't lose visibility.
- Partial failures stay visible. Each endpoint is captured independently. Missing disk data reads
Unavailable, storage errors show their failure, and unavailable totals are omitted. The offline banner names partial refresh failures; unknown data is not labelled healthy. - Orchestrator probes display
/healthz,/liveand/readyindependently. JSON metrics displays the/metricsresponse; the Prometheus text endpoint is a separate scrape target.
Under the hood (for developers)
- Polls
GET /health,/storage,/stats,/healthz,/live,/readyand/metricstogether at the global refresh interval (default 3000 ms). Each response or failure is retained independently. - The Ping button hits
GET /pingon demand only and reports the browser-measured round-trip time; it is not part of the poll loop. - Memory values are reported in MB and uptime in seconds; the page formats them for display.